BIOS E-40 EXAM 1
Hello, dear friend, you can consult us at any time if you have any questions, add WeChat: daixieit
BIOS E-40
2023
EXAM 1
Question I (37 points)
Sickle cell anemia is a hereditary disease caused by a recessive mutation affecting β-hemoglobin. In the rest of this question, normal and mutant β-hemoglobin chains are called HbA and HbS respectively (note that strictly speaking HbA and HbS refers to the complete hemoglobin molecule but we’ll use this nomenclature to identify β-hemoglobin out of convenience).
1. Preparations of β-hemoglobin from healthy donors and a sickle cell anemia patient were submitted to trypsin digestion. The resulting proteolytic fragments were then submitted to a two-dimensional separation combining electrophoresis and chromatography.
The proteolytic mixture is applied at the bottom of a sheet of filter paper and submitted to an electric field. This separation in the first dimension is a native gel electrophoresis. In the second dimension, the separation by chromatography is based on the relative mobility of peptides in an organic solvent that progresses from the bottom to the top of the sheet of filter paper. Hydrophobic peptides migrate with the solvent faster than hydrophilic peptides.
The following diagram shows the position of 5 peptides derived from the proteolytic digestion of HbA or HbS. The black spots represent the position of the peptides after the two-dimensional separation, and the circle limited by a dotted line represent the position that the HbA-derived peptide 3 would occupy. The electrophoresis polarity is indicated by – and + signs. The stars indicate the position where the sample was applied.
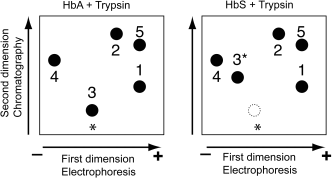
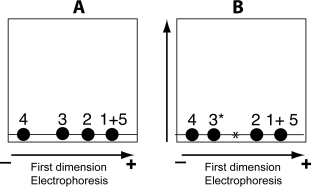
a) On the diagrams below represent show the position of the 5 peptides immediately after the electrophoretic separation. Assign each diagram (A and B) to one of the two digestions (HbA + Trypsin or HbS + Trypsin) Briefly explain your reasoning. (6 pts.)
b) Peptides 1 and 5 share one property and differ by one property. What are these properties? Be as precise as possible. (4 pts)
c) The mutation is due to the substitution of a single amino acid in β-hemoglobin. Based on the difference in the position of peptide 3 for HbA and HbS, predict the change of chemical properties of the peptide caused by the mutation. Briefly explain. (6 pts)
2. In patients with sickle cell anemia both copies of the gene coding for β-hemoglobin have to be mutated since the mutation is recessive. A healthy mother and an affected father have a child at risk for sickle-cell anemia. To predict if the child will develop sickle cell anemia β-hemoglobin samples from the mother (healthy), the father (affected), and the child (unknown) were submitted to trypsin digestion. Peptide 3 derived from each sample was then sequenced by Edman degradation.
a) The following figure shows the results of 3 cycles of Edman degradation for each sample. Indicate the partial sequences of peptide 3 for each individual (mother, father and child). Write your 3 answers starting with the N- terminal. If there is an ambiguity between several possible residues, indicate the various possibilities at relevant position. (9 pts)
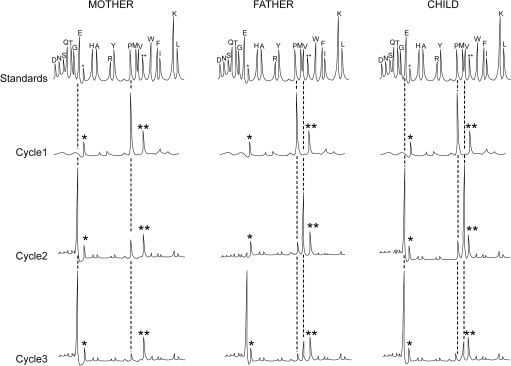
Figure legend: Each column represents the chromatography profiles of three consecutive cycles of Edman degradation on peptide 3. This peptide was derived from the proteolytic degradation of β-hemoglobin prepared from 3 individuals (mother, father & child). The standards show the elution positions of the various PTH-amino acids. Dotted lines should help you to identify the PTH-amino acids produced at each cycle. The peaks labeled *, and ** correspond to by-product of the Edman reaction. There is no M residue in any of the 3 partial sequences.
b) The third amino acid in these partial sequences corresponds to the second-to-last residue in peptide 3. What residue(s) is (are) likely to occupy the last position in peptide 3? Briefly explain. (4 pts)
c) Will the child suffer from sickle cell anemia? Briefly explain. (4 pts)
d) How many spots would you visualize by 2D-separation of trypsinized β-hemoglobin prepared from the child. Briefly explain. (4 pts)
Question II (17 points)
The following diagram (Fig.1) shows the size exclusion elution profile of the sample whose protein content is shown by gel electrophoresis (Lane 1, Fig. 2) .
1) Assign a peak (X or Y) to the protein A and the proteins from the region H assuming that all the
proteins are monomeric and all the proteins from the region H elute in the same peak. Indicate two features of the elution profile that dictate your choice. (8 pts)
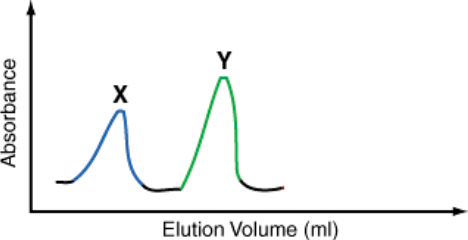
Figure 1
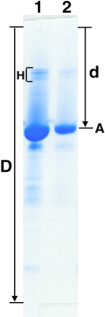
Figure 2 (note that the intense band in lane 1 corresponds to protein A)
2) Indicate whether the following statements are true (T) or False (F) and provide a short explanation (9 pts)
S1: The samples shown in lane 2 (Figure 2) is the result of the purification of A by cation exchange chromatography. The native charge of protein A is negative.
S2: Assuming, the gel has an additional lane with a protein ladder (not shown on figure 2), the ratio d/D can be used to calculate the size or protein A.
S3. If the original sample containing proteins H and A was treated with SDS before its application to the size exclusion column, the peaks X and Y would be closer to each other and shifted to the right.
Question III (12 points)
1. A protein has a monoisotopic mass of 14701 Da. By mass spectrometry the m/z ratio of this protein is 14702.5. Calculate the mass accuracy, expressed in part per million (ppm), of the instrument. (6 pts)
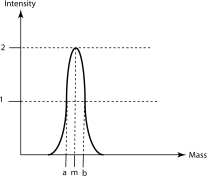
2. The mass spectrometry peak shown below corresponds to a protein with a measured mass m
On the diagram, the 2 vertical dotted lines intercept the Mass axis at positions a and b respectively and both intercept the same horizontal dotted line corresponding to an intensity of 1
You know the following
m = 690.2
a= m - 0.125
b= m + 0.125
Calculate the resolution of the mass spectrometer. Show your calculation (6 pts)
Question IV (34 points)
A tryptic peptide containing 8 amino acids, and starting with alanine (A) was analyzed with a triple-quadrupole mass spectrometer in ms/ms mode. The following figure shows the mass spectrum after fragmentation.
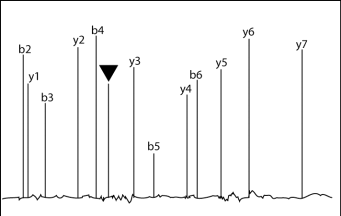
Figure: Peaks from the y and b series are labeled. Series y and b peaks correspond to ions with a single positive charge. The peak labeled with the black triangle is unidentified.
1) Would the ions c3 be located on the right or the left side of b3? Briefly explain. (4pts)
2) The following table gives you the m/z ratio for the ions labeled on the spectrum:
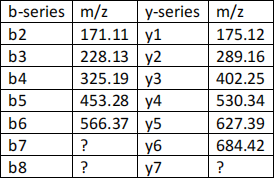
Determine the sequences (based on the b-series and then based on the y series) of the peptide using the table above and the masses of amino acid given in Appendix at the end of the exam.
If a residue cannot be identified from a series, put a question mark at the relevant position. If there is an ambiguity between several possible residues, indicate the various possibilities at relevant position.
Note that the amino acid masses calculated from the experimental ion masses listed in the table above might be slightly different from the masses listed in appendix 2. Therefore, choose from appendix 2 the amino acid with a mass that is the closest to the calculated mass.
a) From the b-ion series (indicates the position of the amino and carboxyl group) (6 pts)
b) From the y-series (indicates the position of the amino and carboxyl group) (6 pts)
3) Calculate the m/z ratio of ion b7. Assume that b7 is single-charged. Show your calculation. (6 pts)
4) A careful inspection of the spectrum suggests that the peak labeled with a black triangle corresponds to a
form of ion b7 with multiple positive charges. Based on the position of this peak and the previously calculated m/z ratio for the single charged ion b7, predict the number of protons associated with the peak labeled with a black triangle. Show your calculation. (6 pts)
5) Based on your prediction, what is the m/z ratio of the ion responsible for the peak labeled with the black triangle? Show your calculation. (6 pts)
Question V (26 points)
1. You plan to purify a protein of known sequence by ion exchange chromatography. Using a software, you have generated an isoelectric plot (see below) for the protein in question .
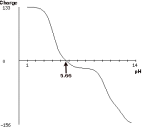
a) What does the intercept of the curve with the x-axis (pH= 5.66) represent? Explain 4 pts
b) You decide to purify the protein by anion-exchange chromatography. The protein is in solution in a buffer . Determine the range of pH of this buffer compatible with purification by anion exchange chromatography.
Explain. 6 pts
c) One of your coworkers reminds you that the protein was re-designed and a stretch of 10 lysine residues was added at the carboxy-end of the protein. If you generate a new isoelectric plot, would the curve shift to the right or to the left? Explain. 6 pts
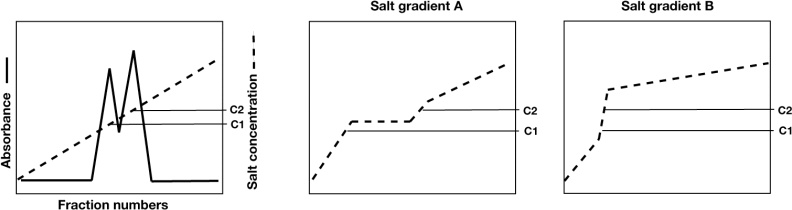
2. The figure below (left panel) shows the chromatography profile when a linear salt gradient is applied to the chromatography column. The two absorbance peaks, correspond to your protein of interest and a contaminating protein. The overlap of the two peaks shows that the resolution is quite poor. You decided to change the applied salt gradient to improve resolution. Which one of the two profiles (A or B) showed on the two panels on the right would you select? Explain. 10 pts
Question VI (28 points)
1) A peptide of the following sequence (NH2)-T-A-V-G-C-A-G-A-R-(COOH) has been fragmented. Amino acid code
T (Thr) = Threonine A (Ala) = Alanine V (Val) = Valine C(Cys)= Cysteine G (Gly) = glycine
R (Arg) = Arginine
a) What is the sequence of the ion y5? (4 pts)
b) Using the table included at the end of the exam, calculate m/z for y5 (show your calculation) (6 pts)
c) Calculate the mass of the peptide before fragmentation (show your calculation) (4 pts)
d) The ESI-spectrum shows that the m/z ratio of the peptide before fragmentation is 403 suggesting that the analyzed peptide carries more than one charge. Briefly explain and calculate how many charges it carries. (6 pts)
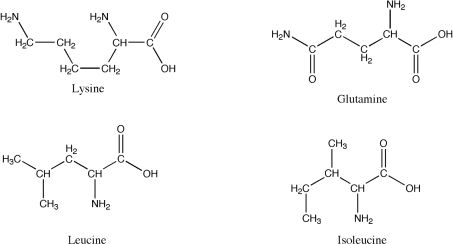
2) The d-series is used to discriminate between two specific residues. Identify these two residues among the four residues illustrated on the next page, and explain how this series is used in the discrimination process. (8 pts)
Question VII (46 points)
A protein sample was isolated from bacteria and submitted to trypsin digestion. A large number of tryptic
peptides were analyzed by ESI-MS/MS. Peptide P1 contains 8 amino acids, has a calculated mass of 856.53 Da and the m/z ratio of the unfragmented peptide is 857.54. The following table shows the m/z ratio of ions from
the b and y series obtained by fragmentation of a single tryptic peptide. The blank spaces in the table correspond to members of the b and y series that were not detected on the spectrum .
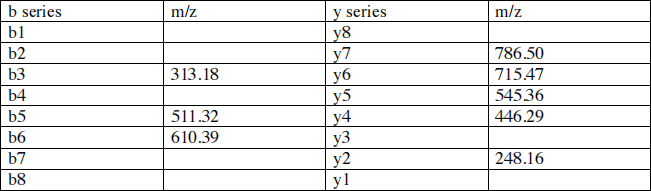
Table showing the m/z ratio of b and y ions resulting from the fragmentation of P1
1. Your first goal is to complete the table by filling the blanks. We’ll assume that all the ions carry a single positive charge due to a bound proton .
a) Calculate the m/z ratio of fragments b8 and y8? Show your calculation and explain. 4 pts
b) Using the known m/z ratio for b5, b6 and y2, calculate the m/z ratio of y3. Show your calculation and explain. 4 pts
c) Using the m/z ratio of y8 and y7, calculate the m/z ratio of the amino acid that occupies position 1 in the peptide sequence . Show your calculation and explain. 3 pts
d) Explain why the m/z ratio of b1 is the m/z ratio calculated in part c + 1. 3 pts
e) Using the m/z ratio of y7 and y6, calculate the m/z ratio of b2. Show your calculation and explain. 4pts
f) Using the m/z ratio of y5 and y4, calculate the m/z ratio of b4. Show your calculation and explain. 3 pts
g) Because the peptide was produced by trypsin digestion the amino acid occupying position 8 is either arginine (Arg) or lysine (Lys). Based on the m/z ratio of Arg and Lys read from the table in appendix A, determine the 2 possible m/z ratio of y1. Show your calculation and explain. 4 pts
h) Based on the known m/z ratio for y2, the two possible m/z ratio for y1 and, the table in appendix A, determine the actual m/z ratio for y1. Explain 4 pts
i) Using the m/z ratio of y2 and y1, calculate the m/z ratio of b7. Show your calculation and explain. 2 pts
2. Determine the amino acid sequence of the tryptic peptide. The m/z ratio that you calculated in previous questions should give you the identity of all the amino acids with the exception of the amino acid that occupies position 3 in the peptide. 4 pts
NH2- - - X - - - - - -COOH
3. In living cells, the activity of some proteins is modified by the addition of an acetyl group (CH3-CO) that
replaces an atom of hydrogen (H) in the protein. The reaction is the following:
Protein + CH3-CO à Protein-CH3-CO + H
a) Calculate the mass shift resulting from the addition to a single acetyl group to a protein. Show your calculation. 2 pts
Atomic masses: C (12), O (16) H (1)
b) To determine the identity of X, you are asked to treat (before mass spectrometry) your tryptic peptide mixture with an enzyme that removes acetyl groups. After this treatment, the spectrum produced by the fragmentation of peptide P1 indicates that the m/z ratio of ions b3 and y6 have changed and suggest that amino acid X was acetylated. calculate the m/z ratio of b3 and y6 after deacylation? Show your calculation. 4 pts
c) What is the identity of X? Explain 3 pts
d) What would be the likely consequence of treating the full-length protein with the enzyme that removes the acetyl group before digestion with trypsin? 2 pts
2023-12-18