ECN 422 PS 5
Hello, dear friend, you can consult us at any time if you have any questions, add WeChat: daixieit
ECN 422
PS 5
Due in class on Nov. 28th
Part 1 Summary
Read textbook Chapter 6 and write a minimum two-page summary
Part 2 Questions
Question 1
A diagnostic test for a certain disease is applied to n individuals known to not have the disease. Let X = the number among the n test results that are positive (indicating presence of the disease, so X is the number of false positives) and p = the probability that a diseasefree individualís test result is positive (i.e., pis the true proportion of test results from disease-free individuals that are positive). Assume that only X is available rather than the actual sequence of test results.
a) Derive the maximum likelihood estimator of p. If n = 20 and x = 3, what is the estimate?
b) Is the estimator of part (a) unbiased?
c) If n - 20 and x = 3, what is themle of the probability (1 -p)5 that none of the next Öve tests done on disease-free individuals are positive?
Question 2
Let X denote the proportion of allotted time that a randomly selected stu- dent spends working on a certain aptitude test. Suppose the pdf of X is
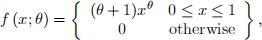
where -1 < θ. A random sample often student yields data x1 = 0:92; x2 = 0:79; x3 = 0:90; x4 = 0:65; x5 = 0:86; x6 = 0:47; x7 = 0:73; x8 = 0:97; x9 = 0:94; x10 = 0:77.
a) Use the method of moments to obtain an estimator of θ, and then compute the estimate for this data.
b) Obtain the maximum likelihood estimator of θ, and then compute the estimate for the given data.
Question 3
Let X represent the error in making a measurement of a physical character- istic or property (e.g., the boiling point of a particular liquid). It is often reasonable to assume that E(X) = 0 and that X has a normal distribution. Thus the pdf of any particular measurement error is
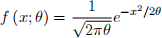
where we use θ iplace of σ2. Now suppose n independent measures are made, resulting in measurement errors X1 = ① 1, X2 = ①2, ..., Xn = ①n. Obtain the mle of θ .
a) Determine the sampling distribution of X = (X1+X2)/2, calculate E(X), and compare to E (X1).
b) Determine the sampling distribution of the sample variance S2, calculate E(S2), and compare to VaT (X1).
Question 4
The shear strength of each often test spot welds is determined, yielding the following data:
392, 376, 401, 367, 389, 362, 409, 415, 358, 375
a) Assuming that shear strength is normally distributed, estimate the true average shear strength and standard deviation of shear strength using the method of maximum likelihood.
b) Again assuming a normal distribution, estimate the strength value below which 95% of all welds will have their strengths. [Hint: What is the 95th percentile in terms of μ and σ2 ?]
c) Suppose we decide to examine another test spot weld. Let X = shear strength of the weld. Use the given data to obtain the mle of P (X 三 400). [Hint:
P (X 三 400) = Φ ((400 - μ)/σ).]
Question 5
Let X be the Bernoulli random variable associated with the probability a worker gets a severe injury at his job in a given year. It takes the value 1 when the individual got an injury in the previous year while working (an event that happens with probability p) and takes the value zero otherwise (with probability one minus p). You obtain a random sample of 15 indi- viduals from the American population and record whether or not they were injured at the job last year (Xi for i = 1; 2; :::; 15) obtaining this sequence of values: X = (0; 1; 0; 0; 1; 0; 0; 0; 0; 1; 0; 0; 0; 0; 0).
a) Let p be the probability that randomly selected American worker gets injury at the job in the course of an year. Find the maximum likelihood estimate of p.
Question 6
Google has 5 open positions for the job of senior programmer/analyst that must be filled as soon as possible. As a result, the Human Resource depart- ment gets the order to stop the search as soon as they find the first qualified candidate for each one of these jobs ñ that is, a candidate with the right qualiÖcations, experience, and that passes the interviewsñ. That is, the HR is instructed to look at the job applications in a first-come, first-serve basis, evaluating the candidatesí CVs and performing the interview as the appli- cations arrive. Whenever a candidate is judged to be qualiÖed, then a job iso§ered and the search for that particular position ends. The HR operates as instructed, and after a little while, they Öll each one of these positions. The exact number of applicants that were interview for each position are showed below.
X = (10; 15; 8; 4; 12);
which means that the first position was filled after interviewing 10 candi- dates, whereas for the second position it took 15 candidates, and so on. Your goal now is to use the data to estimate the the probability that a randomly selected candidate is suitable for the position.
Denote by X the Geometric random variable associated with the number of applicants google had to interview to obtain the first qualified applicant ñ defined as one that was good enough to get the job o§er ñ. The chance that Google finds a suitable candidate whenever is interviewing someone is given by p, which we will assume that is the same for each of the positions. You want to estimate p after observing the data.
a) Write the likelihood function of the parameter p given the data. Hint:
For the geometric distribution Pr[X = xi] = (1 - p)xi -1p.
b) Find the maximum likelihood estimate of p.
c) Find the probability of observing this dataset X = x = (10; 15; 8; 4; 12) when p = 95%. Is this probability high? Explain your answer.
2023-12-16