Econ 151B Winter 2016 Final Exam Version A
Hello, dear friend, you can consult us at any time if you have any questions, add WeChat: daixieit
Econ 151B
Winter 2016
Final Exam Version A
1) TRUE FALSE Questions. Each is worth one point.
a. By comparing the earnings of Vietnam veterans to non-Veterans we can get an estimate of the rate of return to education that is likely to be unbiased.
T FX
b. A good “natural experiment” for estimating the impacts of Affirmative Action programs might be to compare the wages of minorities working in firms with federal contracts to the wages of minorities working in firms that do not have federal contracts.
T FX
c. An unemployment rate of 4% is considered high.
T FX
d. One example of current market discrimination is the current difference between the average quality of elementary schools that minority students attend and the average quality of elementary schools that white students attend.
T FX
e. Age-earnings profiles for men and women look similar at young ages, but the earnings gap widens as men and women grow older.
TX F
f. Estimates of the rate of return to education that compare the earnings and education levels of different individuals are contaminated by ability bias because the individuals who gain the most from investing in education are also the most likely to obtain high levels of education.
T FX
g. If the sibling correlation in earnings in country A is 0.4, and the sibling correlation in country B is 0.3, then country A is the more mobile country.
T FX
h. Compared to young workers, older workers are more likely to lose their jobs during recessions.
T FX
i. More than 80% of unemployed individuals became unemployed by losing their jobs.
T FX
j. In the past 25 years, the 90/10 earnings ratio has grown more than the 50/10 earnings ratio.
TX F
2) Suppose that the relationship between years of education and annual wages can be
written in the following way.
Wagei = 1000 + 3000*Si + 2000*BAi
Where Wi is the wage of individual i, Si is the number of years of education for ndividual i, and BAi =1 if individual i graduates from college, and 0 otherwise.
a) What does the number “1000” tell us? (1 pt)
The average wage of someone with no schooling.
b) What does the number “3000” indicate? (1 pt)
Additional wage associated with each additional year of school.
c) What does the number “2000” indicate? (1 pt)
Additional wage associated with obtaining a BA on top of years of schooling.
d) Does the equation above provide evidence in favor of the signaling model? Why or why not? (2 pts)
No. Conditional on years of schooling those with a BA may have still acquire more human capital.
e) Based on the equation above why doesn’t everyone go to college? (3 pts)
For college to be worth it benefit must be bigger than cost. Some people will have higher costs than others. Some people will have higher discount rates so benefit is lower.
3) Most people who are ever unemployed are unemployed for a short period of time.
However, on any given day, most people who are currently unemployed are in the midst of a long spell of unemployment. Explain how these two statements can both be true. (5 pts)
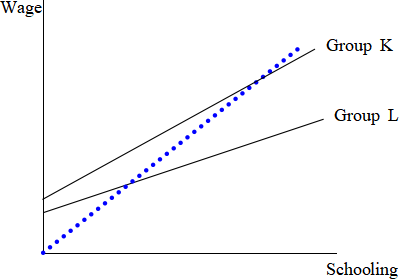
4) Suppose that there are two groups of potential workers: group K and group L. On average, both groups of workers are equally skilled. However, education is a better predictor of a worker’s skill level for members of group K than for members of group L.
Wages are determined using information on an individual’s level of education, and using information on the average skill level of the group to which the individual belongs.
The diagram below shows the relationship between wages and education for group L.
The dotted line is a 45 degree line.

a) On the diagram above, draw the relationship between wages and education for group K relative to group L. Make sure that you label the relationship for each group. (2 points)
b) Now draw another diagram for groups K and L, similar to the one in part a).
Maintain the assumptions from above, except now you should assume that the two groups differ in their average levels of skill. Assume that the average skill level of members of group K is higher than the average skill level of members of group L. (3 points)
c) Using these two diagrams, explain how the wage profiles for groups K and L might lead to a cycle where the wage gap between the two groups gets perpetuated across generations. (3 points)
Even though group K and L start with the same average level of ability, since there is a higher return to schooling for members of group K, they will be more likely to invest in additional education. This will cause them to acquire more human capital over time, which will eventually increase K’s average “ability”.
d) Is the discrimination that arises in the diagrams in parts a) and b) necessarily driven by prejudice? Why or why not? (3 points)
No. It is making use of an accurate signal about likely productivity that is provided by an individual’s group membership.
5) The diagram below shows the distribution of hourly wages for unionized and non-unionized workers in both 1979 and 1988. The wage distribution for all workers is indicated by the dashed line. Use evidence from these figures to describe how changes in the relative importance of the union sector affected inequality over this period. ( 6 pts)
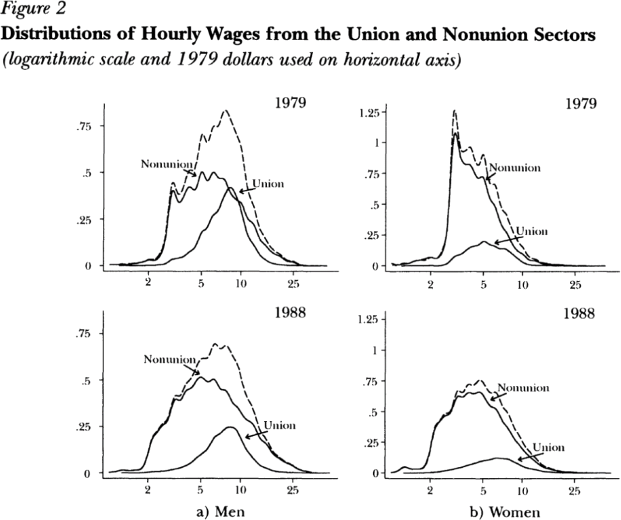
You can see that the wage distribution of unionized workers is more compressed than for nonunion workers. You can also see that as the union power declined between 1979 and 1988 the fraction of workers covered by unions fell and the wage distribution of non-unionized workers became wider. Since the full wage distribution includes both unionized and non-unionized workers, this process caused the entire distribution to widen.
2023-12-15