Econ 151B Fall 2015 Final Exam
Hello, dear friend, you can consult us at any time if you have any questions, add WeChat: daixieit
Econ 151B
Fall 2015
Final Exam
1. Circle True (T) or False (F)? (1 point each)
a) The rate of return to education is the rate at which education changes over the life-cycle
T FX
b) Prejudiced employers who discriminate are engaging in statistical discrimination
T FX
c) One of the assumptions behind the human capital model of education is that there is asymmetric information
T FX
d) One of the assumptions behind the model of statistical discrimination is that there is asymmetric information
TX F
e) The unemployment rate is currently 8%
T FX
f) Structural unemployment can be reduced by stimulating aggregate demand for goods and services
T FX
g) About 80% of earnings inequality can be attributed to family background
T FX
h) The “polarization” of the labor market began during the 1990s
T FX
2. Use the Human Capital Model to explain why age-earnings profiles for women are flatter than they are for men. (3 points)
Because women are more likely to engage in child rearing activities they invest less in job-specific human capital and therefore have lower wages later in adulthood.
3. In their paper “Are Emily and Greg More Employable than Lakisha and Jamal?” Bertrand and Mullainathan use an alternative audit strategy to estimate the level of discrimination encountered by blacks in the labor market. This method does not involve in person interviews, but is based on resumes only. (6 points)
a) In one or two sentences describe what Bertrand and Mullainathan do in their study (1 pnt)
They randomly assign names to resumes. Some names are common black names, and some are common among whites. They send the resumes to job openings and compare call back rates by type of name.
b) What do they find? (1 pnt)
“Black” sounding names get fewer call-backs than “white” sounding names.
c) In what ways might their estimates be more accurate measures of discrimination than estimates based on an in person audit? (2 pts)
Do not need to worry about Hawthrone effects and badly matched pairs because no actual people perform the audit.
d) Why might their estimates be less accurate measures of discrimination than estimates based on an in person audit? (2 pnts)
Discrimination might be due to unusual names rather than race per se. Discrimination can occur at other stages of the job search process, such as after an interview. The resume stage will not capture that type of discrimination.
3. Consider two groups of people—“Blues” and “Greens.” The cost of education is the same for each. The average level of education for Blue types is 15 years. Blue types earn an average salary of $120,000. The average level of education and salary for Green types is 13 years and $100,000. Why is it that 10 percent, which is calculated as ($120,000-$100,000/(15-13)) is not a good estimate of the annual return to an additional year of education? (6 points)
Because we do not know what the Blue would have earned if they had chosen 13 years of education and we do not know what the Greens would have earned if they had chosen 15 years of education. There is a reason that different people make different educational investments and those reasons are correlated with their wages. One type of a person is not a good counterfactual for another type. For example, if the Blues get more education than the Greens because they have a higher rate of return, then the estimate will be contaminated by selection bias. As another example if differences in ability are correlated with both wages and educational choices then the estimated rate of return may be contaminated by ability bias.
4. Use the results from the paper “Who Suffers During Recessions?” by Hoynes, Miller and Schaller to answer the following questions (8 points)
a) How did unemployment during the Great Recession compare to other recent recessions in terms of its duration and severity? If you can, provide some numerical evidence to back up your answer.
b) Which demographic groups’ employment outcomes were most hurt by the Great Recession?
c) Why were these groups more affected by the Great Recession than other groups?
d) How do the differences in different demographic groups’ employment experiences during the Great Recession compare to their experiences in other recessions?
5. The change in the skill composition of the labor force can be decomposed in the following way:
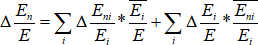
{ 1 } { 2 }
Where E denotes the number of employees, n denotes “low-skilled,” and i denotes industry. ![]() indicates a “change” and a line over a quantity,
indicates a “change” and a line over a quantity, ![]() , indicates that the quantity is averaged over all relevant time periods.
, indicates that the quantity is averaged over all relevant time periods.
The equation above is the same as the equation I presented in class during the unit on inequality.
Data on employment at the industry level can be applied to this equation to assess whether increases in earnings inequality are more likely related to changes in technology or changes in international trade. This amounts to using data to compare the magnitude of {1} to the magnitude of {2}.
Suppose that {1} is three times larger than {2}. What does that imply about the relative importance of technology versus international trade as contributors to widening earnings inequality? Explain your answer. (4 points)
2023-12-14