BME 182 DYNAMICS: PROJECT
Hello, dear friend, you can consult us at any time if you have any questions, add WeChat: daixieit
BME 182 DYNAMICS: PROJECT
Description
This project will offer you an opportunity to put what you learned about the Kinetics of Particles into practice in design and analysis of a vehicle stopping device (bumper). You will design and build a bumper and use it to stop a vehicle traveling down an inclined plane in the experimental test rig shown below. During the experiment you will collect experimental data about the performance of your bumper and a mock bumper. You will analyze the experimental results of the two bumpers and compare among the two sets of experimental results and the theoretical predictions underlying your design. The project is meant to give you theoretical and practical experience in the design of dynamic systems and in the handling of imperfect materials and assumptions.
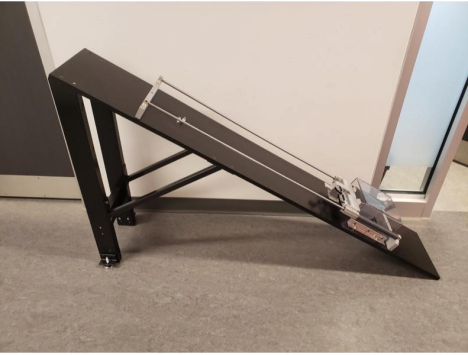
Figure 1: Picture of the test rig
The vehicle mass is 1.88 kg. It slides down a 30o incline a distance of 740 mm to collide with a bumper, Figure 2. The vehicle does not touch the wooden surface of the incline. Rather, it slides along two metal bars on either side. You will design and fabricate a bumper to decelerate the vehicle as gently as possible. This is a subjective user / customer statement. As a designer, you need to interpret this into an engineering specification. Note that the bumper must fit completely within the rectangular volume at the bottom end of the ramp, see dimensions in Figure 2, and fill at least two thirds of the space.
You will then conduct two experiments on the experimental test rig shown in Figure 1. In Experiment # 1, the vehicle will collide with an existing Styrofoam bumper. In experiment # 2, it will collide with the bumper you designed. During the experiments, an accelerometer rigidly attached to the vehicle will record its acceleration versus time using the MetaBase App. You will collect the data from Experiments # 1 & 2. Then, you will process the data, see the Data Processing addendum, to obtain the velocity before and after impact in each experiment.
The “Bumper Test” will beheld in the student design center (first floor, E5) on Thursday, November 30, from 3:00 PM to 5:30 PM and Friday, December 1, from 2:30 PM to 5:00 PM.
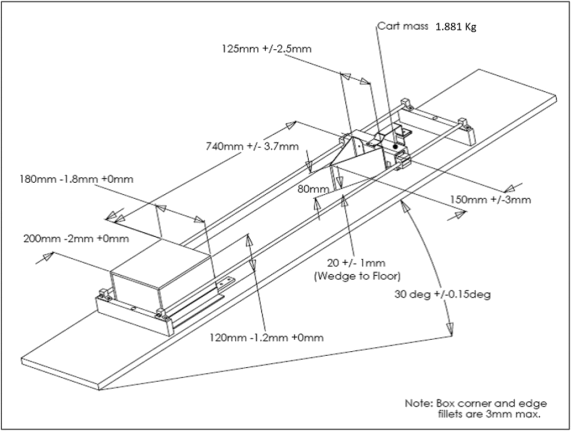
Figure 2: Schematic of the test rig
Design Teams
The project must be completed by 4-member teams. Signup to a group on CowrdMark by October 31, 2023. Groups may contact Mr. Jadon Feng over Teams by Thursday, November 16 to request one of the two test days on a first-come-first-serve basis. The test timetable will be posted to UW Learn on Monday, November 20.
Construction Materials
The bumper is to be constructed from wooden popsicle sticks (4.5in x 0.375in x 0.0625in), rubber bands (size #31 or #32), and pushpins or thumb tacks. Glues of various types maybe used to bond the construction components together and may also be used to create damping or frictional elements. You can also use 0.0625 in or 0.125 in thick wood structures cut using the laser cutters at WATiMake or similar laser cutters instead of the popsicle sticks.
Grading
The project report is due by December 5 submitted via CrowdMark. It will be graded out of 100 points according to the following rubric:
1. Organization & Writing: The report should include a Title page, a short Introduction, a Results section with appropriate figures clearly explained, and a Discussion and Conclusions section. The introduction should include a subsection entitled “Contributions” where each group member describes their contributions to the project activities and the production of the report. /10 points
2. Significance of individual contribution : /10 points
3. Theoretical/Ideal Case: Speculate or calculate the best deceleration profile that meets your engineering specifications and delivers the customer desired minimum deceleration experience by the car. Compute by hand or numerical simulation the theoretical acceleration versus time and plot it. You may use what you learned in your differential equations course (SYDE 211) to simulate the acceleration profile (acceleration versus time) and estimate the stiffness and damping required to obtain it. /10 points
4. Design Innovation: Your bumper design should attempt to approximate the ideal case to some degree. Thoughtful creativity will be rewarded. /10 points
5. Design Documentation: A construction guide should be included that would allow someone to build an identical bumper system. A complete list of materials should also be given. /5 points
6. Material Characterization: Detail how the materials were characterized including documentation of assumptions and their justification. /5 points
7. Results: Present your experimental results. Specifically,
1) Determine the friction coefficient between the vehicle and metal bars.
2) Plot the velocity and acceleration time-histories from the point the vehicle starts down the incline to the point it comes to stop after the impact for both experiments.
3) Determine the peak velocity before vb and after impact va.
3) Determine the linear impulse due to collision with the two types of bumpers.
4) Determine the coefficient of restitution between vehicle and the two types of bumpers. Show your steps and explain your calculation procedure. /30 points
8. Discussion: Discuss and analyze your results. What you did right or wrong and whether you would have done it differently given another chance. Specifically,
1) Compare the velocity and acceleration profiles during the two experiments.
2) Calculate the theoretical velocity before impact vb and compare it to the experimentally measured velocity for each of experiments # 1 and 2.
2) Estimate the average experimental acceleration during in each of experiments # 1 and 2 and compare it with the theoretical value.
3) Compare the linear impulse and coefficient of restitution of the two bumpers. Investigate and comment on (explain the reasons for) their similarities and differences.
4) Compare your predicted deceleration profile (used in design) to those measured for the two bumpers during the experiments and draw conclusions about your design and experiment.
Comment on what you did right and wrong and whether you would have done it differently given another chance. If the bumper fails during the experiment or experimental data diverges significantly from theoretical predictions, you should explain/justify that and provide suggestions for improvement. /20 points
Grades will be assigned based on the quality of the project and the quality of the submitted reports (common to all group members) as well as the level and quality of the individual contributions of each group member (individual).
2023-12-13