FIT9136 Algorithms and programming foundations in Python
Hello, dear friend, you can consult us at any time if you have any questions, add WeChat: daixieit
FIT9136
Algorithms and programming foundations in Python
Assignment 2
1 Introduction
So no one told you life was gonna be this way...But Chandler has just got a new job as the Head of Data Scientists, instead of ”transponster”. Now, he has a project in hand, which is to process and analyse some scripts of sitcoms, and has assigned you to do the task.
2 Data
You are given a script of an episode of a sitcom as a txt file(input script.txt) in the fol-lowing format:
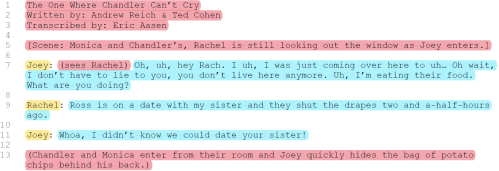
Figure 1 – Visualization of a data sample. The numbers on the left-hand side indicate the line numbers and do not belong to the document.
The parts that are highlighted in yellow are the names of the characters who are speak-ing, while those highlighted in blue are the dialogues of the corresponding characters.
The parts that are highlighted in red are other meta-data, which contains other informa-tion, such as the instructions of movements, the episode name etc. We can assume all the instructions of movements within the dialogue are encapsulated with brackets, i.e. ‘(‘ and ’)’. For example, you can refer to the part highlighted in red in line 7 from Figure 1.
3 Task Description
This assignment includes four coherent tasks. You have to create 2 classes to handle different tasks specified in following subsections. Please note that tasks with similar nature should be performed using the same class.
3.1 Task 1: Extracting Dialogue
In this task, you have to:
1. Extract dialogue lines from the original script file (lines highlighted in yellow and blue from Figure 1).
2. Remove all other meta-data (parts highlighted in red from Figure 1).
3. Return the pre-processed script in a list of tuple(order retained), where the first item of each tuple is the character name, and the second item of which is the corresponding cleaned dialogue.
4. Save the returned list to a “.txt” file with “<student_id>_<clean_dialogue>.txt” naming convention. For example, if your student_id is 12345678, then the name of the output file should be “12345678_clean_dialogue.txt”.
3.2 Task 2: Separating Dialogue
In this task, you have to:
1. Separate the dialogues of different characters(roles)
2. Output the dialogues of different roles, one line per dialogue, to corresponding files with “<student_id>_<character_name_in_lower_case>.txt” naming con-vention. For example, if there are 3 characters in total, 3 files will be created, one for each character respectively.
Specifically, if your student_id is 12345678, then all the dialogues for Joey will be outputted to file “12345678_joey.txt”. Its format can refer to Figure 2.

Figure 2 – “12345678 joey.txt” obtained from data sample in Figure 1, the numbers on the left-hand side indicate the line numbers and do not belong to the document.
3.3 Task 3: Obtaining Top 5 Frequent Words For Each Role
Line frequency of a word refers to how many lines in a document contains the word. For example, if a document has 3 lines, the maximum line frequency of a word is 3. In our scenario, a line refers to a whole dialogue, as indicated by the line number in Figure 1.
In this task, you are asked to find top 5 words with highest line frequencies(case-insensitive) for each role, who has spoken more than 100 unique words and store the information in one DataFrame with 3 columns:
1. role: to record who the word belongs to(character name in lower case).
2. word: to record the word(in lower case).
3. freq: to record the line frequency of the word.
Finally, you need to export the DataFrame created as csv file with naming convention of “<student_id>_data.csv” and return the DataFrame created. If your student_id is 12345678, then the output file name will be “12345678_data.csv”.
3.4 Task 4: Visualising The Findings From Task 3
In this task, you will need to:
1. Visualise the DataFrame created in Task 3 with an appropriate graph.
2. Justify the choice of the graph.
3. Provide concise and precise observations6
4 Other requirements
1. The code should be developed on Python 3.
2. You are only allowed to use os, re, math, random, collections, NumPy, mat-plotlib, SciPy and pandas libraries.
3. You have to call the class methods to perform the tasks.
5 Submission
In order to finish this assignment, you are required to include all the solutions in a jupyter notebook with naming convention of “<student_id>_Asg2.ipynb” as well as a Python file with the naming convention of “<student_id>_Asg2.py” on Moo-dle(input file and files generated are not required). For instance, if your student id is 12345678, then you need to submit “12345678_Asg2.ipynb” and “12345678_Asg2.py” files. The instruction for preparing the “.py” file is available on Moodle.
Please make sure the submission file and the files generated strictly follow the naming conventions specified. Also, please make sure the submission is not in draft mode. Heavy penalties will be applied otherwise.
6 Marking Criteria
6.1 Outputs From Tasks 1 to 3(45% In Total)
Percentage distribution of output from each task:
1. Extracting Dialogue(Task 1): 15%
2. Separating Dialogue(Task 2): 15%
3. Obtaining Top 5 Frequent Words For Each Role(Task 3): 15%
For each task, the score will be calculated based on the percentage of correctness from the output. For example, in task 2, if 10 lines are extracted correctly in Task 2, while there are 15 lines in total, you will get 10 out of 15 marks. The evaluation is based on another input script with highly similar format.
6.2 Quality Of Graph And Its Explanation From Task 4(10% In Total)
● Hurdle: A graph can be successfully created.
● HD: A high quality graph which can visualize data in a meaningful way is cre-ated. Justification of using such graph is well explained. The observations from the graph are precise and concise.
● D: A graph which can visualize data in a meaningful way is created, with some of the information missing. Justification of using such graph is fairly explained. The observations from the graph are correct.
● C: A graph which can visualize data is created, with most of the information missing. Justification of using such graph is fairly explained. The observations from the graph are correct, but some of the most significant information are missing.
● P: A graph which can visualize data is created, with most of the information missing. Justification of using such graph is not clearly explained. The observa-tions from the graph are not well explained.
● F: A graph is not properly created, with most of the information missing. Justifi-cation of using such graph is not explained. The observations from the graph are inaccurate.
6.3 Quality Of Code Structure And Style(25% In Total)
● HD: Simple and clear logic is demonstrated through the code. All of the meth-ods of different tasks are put into correct classes. The variable names are self-explanatory. The data types used are appropriate and efficient.
● D: Clear logic is demonstrated through the code, with some redundancy. Most of the methods of different tasks are put into correct classes. The variable names are mostly understandable. The data types used are appropriate.
● C: Many redundant codes are included in submission. Most of the methods of different tasks are put into correct classes. Some of the variable names are not understandable. Some of the data types used are not appropriate. C is also the highest possible grade for this section if any of the following conditions is met:
1. Class implementation is not used in this assignment.
2. No demonstration of using the class methods created to perform the tasks.
3. Libraries not mentioned in Section 4 are used.
● P: Many redundant codes are included in submission. Most of the methods of different tasks are not put into correct classes. Most of the variable names are not understandable. Most of the data types used are not appropriate.
● F: The logic of the code does not lead to solving the tasks, with some syntactic error.
6.4 Quality Of Documentation(10% In Total)
● HD: The code is well documented, with proper header comments and inline comments.
● D: The code is properly documented, with some redundant comments(e.g. very simple logic) or missing some important comments(e.g. complicated logic).
● C: The code is documented, but the comments do not explain the code logic comprehensively.
● P: The code is documented, but the comments fail to explain the logic of the code.
● F: The code is not documented, or the comments are not understandable.
6.5 File Naming(10% In Total)
● 10%: All files(jupyter notebook and output files) are named correctly.
● 3%: Some files are named incorrectly.
● 0%: No files are named correctly.
7 Support And Assistance
It’s like you’re always stuck in second gear? No worries, we’ll be there for you.
7.1 English language skills
If you don’t feel confident with your English. You can talk to English Connect.
7.2 Study skills
If you feel like you don’t have enough time to do everything you need to, maybe you need a new approach. You can talk to a learning skills advisor.
7.3 Things are tough right now
Everyone needs to talk to someone at some point in their life, no judgement here. You can talk to a counsellor(friendly, approachable, confidential, free).
7.4 Things in the unit don’t make sense
Even if you’re not quite sure what to ask about, if you’re not sure you won’t be alone, it’s always better to ask.
● Ask in the Ed forum.
● Attend a consultation.
7.5 I don’t know what I need
Everyone at Monash University is here to help you. If things are tough now, they won’t magically get better by themselves. Even if you don’t precisely know, come and talk with us, and we’ll figure it out. We can either help you ourselves or at least point you in the right direction.
2021-10-06