AD699: Data Mining for Business Analytics Fall 2018 Quiz 3
Hello, dear friend, you can consult us at any time if you have any questions, add WeChat: daixieit
AD699: Data Mining for Business Analytics
Fall 2018
27NOV2018
Quiz 3
QUIZ #3: Question Bank
For the next five questions, please refer to the following set of 15 transactions. Each line represents one transaction. Each transaction represents a customer’s set of downloads during a virtual “trip” to the App Store. Within each transaction, the apps are listed in the order in which they were downloaded (the order has no meaning).
1. Bitmoji, Snapchat, Messenger, SoundCloud, Waze
2. Bitmoji, Snapchat
3. SoundCloud, Waze, Netflix
4. Snapchat, YouTube, Wish
5. Snapchat, Facebook, Google Chrome, Waze
6. Bitmoji, Messenger, SoundCloud, Waze
7. Bitmoji, WhatsApp, Spotify, Uber
8. WhatsApp, Messenger, SoundCloud, Waze, Google Maps, Lyft
9. Bitmoji
10. Bitmoji, Snapchat, Netflix
11. Bitmoji, Snapchat, Twitter, SoundCloud, Facebook, Waze
12. Messenger, Waze
13. Netflix, Amazon
14. Gmail, Uber, Spotify
15. Snapchat, Netflix, Spotify, Waze, Google Maps, Lyft
1. What is the support for {Bitmoji, Snapchat}?
2. What is the confidence for IF {Snapchat, Facebook} THEN {Waze}?
3. What is the support for {Messenger, SoundCloud, Waze}?![]()
4. What is the lift ratio for IF {Bitmoji}, THEN {SoundCloud, Waze}?
5. What is the lift ratio for IF {Snapchat} THEN {Netflix}?
6. Which ONE of the following statements can be properly concluded based on the screenshot of the association rule shown below? (The left-hand side of the rule is separated from the right-hand side of the rule by the => symbol). Reading from left to right, the first value shown is the support for the rule, the second value is the confidence, and the third is the lift ratio.

a. Someone who buys root vegetables and yogurt is three times more likely than a randomly-selected shopper from this dataset to buy tropical fruit.
b. If someone buys root vegetables or yogurt, there is an approximately 31 percent chance that he or she will also buy tropical fruit.
c. If someone buys root vegetables but does not also buy yogurt, there is only a .8 percent chance that he or she will buy tropical fruit.
d. 8.13 percent of all consumers in the dataset bought root vegetables, yogurt, and tropical fruit.
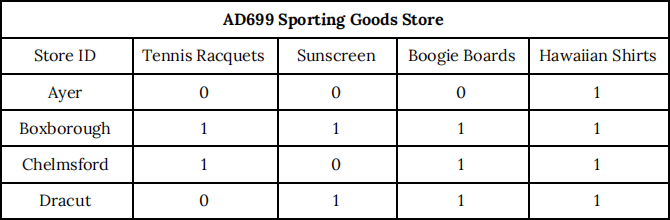
7. The table below shows categorical values -- a 1 in a particular cell indicates that the store carries in the item in stock, whereas a 0 indicates that the item is not stocked by that store. Given the information contained in the table below, what is the Jacquard coefficient between Boxborough and Dracut?
8. Which of the following is a difference between k-means clustering and hierarchical clustering?
a. In k-means clustering, the software selects the numbers of clusters; in hierarchical clustering, however, the number must be specified by the user.
b. In k-means clustering, the records must first be labeled with cluster assignments; with hierarchical clustering, however, the algorithm makes the assignments.
c. Hierarchical clustering involves an initial step in which records are randomly assigned to a particular clustering, whereas k-means clustering tends to be more orderly.
d. With hierarchical clustering, clusters are nested within one another; in k-means, this is not the case.
9. Nothing is ever ideal in data mining, especially when real-world data is involved. However, which of the following statements describes an ideal clustering solution (if such a thing could exist)?
a. A solution in which records assigned to any particular cluster were very different from other records in that same cluster.
b. A solution in which the records were very similar to other records assigned to the same cluster, and also very different from records assigned to other clusters.
c. A solution in which each record could remain in its own cluster, due to its independence and non-hierarchical nature.
d. A solution that assigned similar records to different clusters, to ensure the right degree of randomness in the outcome.
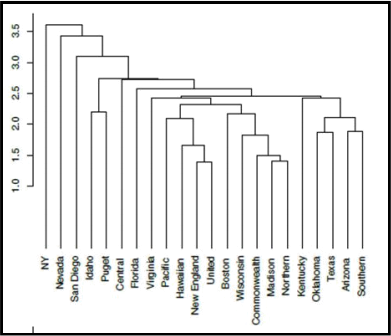
10. For the dendrogram shown immediately above, which of the following would be true with a distance cutoff of 2.5?
a. At that distance, Southern is still by itself (it has not yet joined any clusters).
b. At that distance, the only cluster to have formed is New England and United.
c. At that distance, there would be a total of two separate clusters formed.
d. At that distance, Idaho will have formed a cluster only with Puget.
11. Suppose we used the screenshot below, which depicts Henry’s nearest neighbors, measured by Euclidean distance, based on answers to a personality survey, in order to build a recommendation system. Imagine that we instruct our model like this: “Recommend to Henry any content that either Ya, Andrey, or Charlotte have liked, regardless of what the content actually is.”
What would we be doing here?
a. User-based collaborative filtering.
b. Item-based collaborative filtering.
c. Content-based filtering.
d. A/B testing.

12. Suppose you are engaging in a word analysis exercise. You are given a list of five great novels, and then you are asked to generate, and then compare, a list of the 20 most-frequently used words in each of the books. You try this exercise without removing stopwords, and then a second time with the stopwords removed. How will the lists change?
a. When you remove the stopwords, the meaning of the novels will become less clear.
b. When you remove the stopwords, the total word count in each of the novels will increase.
c. The stopword removal will be meaningless unless it is accompanied by stemming.
d. When you leave the stopwords in, you should expect to see more overlap among the most commonly-used words in each novel.
13. A common file extension in data mining is the .csv, whose letters stand for “comma-separated values.” If commas are used to create a boundary between values, then they are a:
a. token.
b. stopword.
c. corpus.
d. delimiter.
14. Person A yells out “No trees allowed here, bro!” at another passenger on the Green Line between Arlington and Copley. Wondering if a fight might break out, you take off your headphones and begin to listen.
Person B responds: “First, why were you looking at my monitor? Focus on your own self. But anyway, why don’t you think I should use a tree here? I was just about to call the library function on rpart,” replies the second passenger.
Person A comes back with, “Look at these outliers! Classification trees are great -- please don’t get me wrong, I love them -- but when data includes outliers, the results are unreliable.”
Person B responds, “You’re talking that crazy talk again! Trees separate records into different groups. A huge outlier in either direction isn’t going to change that. I’m going to use a classification tree in my model, and you’re not going to change that.”
Who is right here?
a. Person A is correct. Before considering whether to use a tree model, the analyst should first check for outliers. If outliers are present, they should either be removed, or another classification algorithm should be chosen instead.
b. Person B is correct. Splits in tree models are built to separate records into different groups. An outlier in either direction won’t change the reliability of the model.
c. This all depends on the package used in R. For someone using rpart, outliers, won’t be a problem, but for someone using the tree package, outliers will make the result unreliable.
d. Technically, they’re both wrong. Outliers will not impact a tree model, but missing values will render the model useless. If a dataset contains missing values, it should not be used with a tree model.
15. A classification tree built with binary decision nodes has four leaves. How many decision nodes does it have?
2023-12-07