STAT 4051 Final Exam
Hello, dear friend, you can consult us at any time if you have any questions, add WeChat: daixieit
STAT 4051 Final Exam (Sample)
. Organize your work, in a reasonably neat and coherent way, in the space provided. If you need more space, use the back of the pages; clearly indicate when you have done this, otherwise you will not receive the credit.
. Unsupported answers will not receive full credit. Unless noted otherwise, a correct answer, unsupported by calculations, derivations or explanation, will receive no credit; an incorrect answer supported by substantially correct work might still receive partial credit.
. Avoid multiple solutions.. Please only provide one solution to each problem. If multiple solutions are presented, the worst solution will be used to determine your credit.
1. Multiple choice problem. There is only one correct answer in each problem.
(a) (4 pts) Principal Component Analysis (PCA) is primarily used for:
a. Increasing the number of variables
b. Reducing the number of variables
c. Predicting categorical outcomes
d. Classifying data into clusters
(b) (4 pts) In the after-war period (1945–1955), what did most female brilliant minds take the main role in scientiic research?
a) Programmer
b) Cashier
c) Sanitor
d) Grant manager
(c) (4 pts) Which is not true about graphical models?
a) They are modeling the dependence between observations.
b) Graphical models are probabilistic models.
c) Ising model is a special case of graphical models.
d) Gaussian graphical models assume multivariate normal distributions for the data.
(d) (4 pts) Which of the following is not true about graph data?
a) Graphs/networks are structured multivariate data.
b) The scale-free degree phenomenon is a universal pattern in real-world networks.
c) A node degree in an undirected network is the number of connections the node has. d) In some networks, the edges can be directed.
2. (18 pts) Suppose that for a particular data set, we have 6 observations and their mutual distance is given by the following

(a) Suppose we will cluster the observations by hierarchical clustering. Plot the dendrogram of the clustering by complete linkage.
(b) Suppose we want to use spectral clustering to cluster the data points. We need to construct the 2-NN graph of the six points. Draw the graph.
(c) Calculate the node degrees and the graph diameter of the graph you get in (b). Which node has the highest closeness centrality?
3. (24 pts) A biologist is working on a data set from her experiment of measuring the volume of 10 diferent subtypes in a group of patients. She got a data matrix of dimension 200 9, where each column corresponds to one subtype of blood cells and each row corresponds to the patient. She generates the histograms of the 9 variables as below.

(a) The biologist wants to use the data matrix as the input to it a Gaussian graphical model. Do you think this is reasonable? Explain your argument.
(b) Suppose now the biologist applied proper data processing and transformation and then it a Gaussian graphical model with the processes data using the graphical lasso method, which as we can recall, maximizes the following criterion to solve for the Θ matrix:
log det(Θ) - tr(ΘS) - λIΘI1 :
She has to pick a tuning parameter λ in the graphical lasso algorithm. If she has no prior information or idea about what type of graph she needs, how would you recommend her to tune the λ?
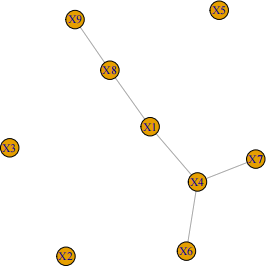
(c) After using your previous procedure, she picks λ = 1:5. The graphical lasso itting results in the following graph structure. Her interpretation is that the volume of the 9th cell type is independent of the volume of the 4th cell type. Is this correct? Explain your answer.
(d) Suppose she tries another λ, by setting its value to be 108. What do you expect to get as the resulting estimated graph?
4. (12 pts)
(a) You are provided with ive short documents, each containing a unique set of words. The documents are as follows:
Document 1: "Apples are sweet and apples are nutritious . "
Document 2: "Bananas are also sweet, but they have a different texture . "
Document 3: "Fruits like apples and bananas are good for health . "
Document 4: "Eating fruits daily can improve health . "
Document 5: "Sweet fruits such as bananas and apples are popular among children . "
For this task, use the following vocabulary as your set of unique words: [apples, bananas, sweet, fruits, health]. Convert these ive documents into a document-term matrix using the speciied vocabulary.
(b) Now suppose we have a data set of 2000 documents we will use a vocabulary of 500 words. Therefore, the true document-term-matrix will be 2000 x 500. if we want to ind some meaningful intrinsic dimensions and interpretations to understand the data. What methods do you suggest are proper for the data? Name at least two approaches. Briely discuss their diferences.
2023-12-01