AMS 394: Statistical Laboratory
Hello, dear friend, you can consult us at any time if you have any questions, add WeChat: daixieit
AMS 394: Statistical Laboratory
Project: Statistical Methods for Partially Matched Samples
Due December 8, 2023, 11:59pm
Fall 2023
1 Description
The objective of this project is to extend the two-sample statistical concepts and techniques learned in class to analyze partially matched samples. In real-world research scenarios, the available data often deviate from traditional designs such as independent samples or complete matched pairs, leading to partially matched samples where some observations are missing in one or both groups.
For instance, in clinical studies, a medical researcher may want to compare two measurement methods, referred to as methods A and B, for assessing cardiac output. When all values are present in the samples, they are considered complete matched samples. Standard hypothesis testing proce- dures like the paired ttest and the paired Wilcoxon test can be used to evaluate the null hypothesis of the mean difference between paired observations in complete matched pair designs. However, when dealing with partially matched samples, alternative appropriate statistical procedures must be employed.
In this project, we will explore the use of suitable statistical procedures to analyze such data. Each student in the class will have the opportunity to develop an R function that implements appropriate statistical procedures, including Kim etal.’s modified t statistic and Looney and Jones’s corrected Z test. These procedures are specifically designed for partially matched samples and will be introduced in the context of this project.
2 Background
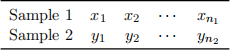
We have previously studied two designs for comparing two populations: independent samples and complete matched samples. Independent samples are represented by two separate sets of observa- tions:
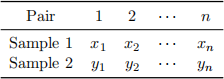
Complete matched samples consist of pairs of observations:
3 Partially Matched Samples
Partially matched samples involve pairs of observations with missing values, where some pairs are fully matched, some have missing values for one variable, and others have missing values for the other variable. The data structure for partially matched samples can be represented as follows:
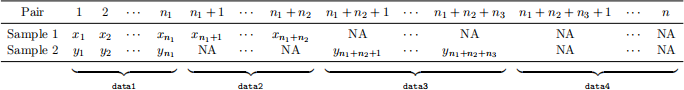
In this table, n1 represents the number of fully matched pairs, n2 represents the number of pairs with missing values only in Sample 2, and n3 represents the number of pairs with missing values only in Sample 1. It is also possible that n4 pairs of the samples have all missing values, but this scenario will not affect the analysis as these pairs can be omitted directly. It is important to note that pairs are typically not ordered as shown in the table.
Denote the subset of data data1 with the n1 fully matched pairs, the subset data2 with the n2 Sample 1 observations paired with the missing values in Sample 2, the subset data3 with the n3 Sample 2 observations paired with the missing values in Sample 1, and the subset data4 with the n4 matched NA observations.
Discard data4 before our analysis. The rest of the combined data data1, data2, and data3 are, in fact:
. n1 matched pairs (data1) and
. two independent groups with sample sizes n2 and n3 (Sample 1 from data2 and Sample 2 from data3), where both groups’ experimental designs aim to estimate the same parameter (e.g., the difference of means of the two groups is 0).
Consider the most general case where n1 , n2 , n3 > 0 in the given data. There are two options if we only consider the basic data analysis procedures to analyze partially matched samples:
1. Analyze the n1 matched samples (data1) using paired-sample methods (the paired t test or the paired Wilcoxon test).
2. Treat the group of n1 + n2 observations in Sample 1 (Sample 1 from the combined data of data1 and data2) and the group of n1 + n3 observations in Sample 2 (Sample 2 from the combined data of data1 and data3) as two independent samples.
However, Kuan and Huang [KH13] argue that the above approaches are not the best choices. Paired-sample methods for a subset do not utilize all the information provided in the original data, while considering the partially matched samples as two independent samples may overlook the inherent pair correlation structure between the matched samples. Kuan and Huang’s paper summarizes five statistical analysis methods used for analyzing partially matched samples, and we will study the details of two of them.
4 Statistical Analysis Methods
4.1 ![]() Kim et al.’s Modified t Statistic
Kim et al.’s Modified t Statistic
Let D and SD represent the mean and standard deviation, respectively, of the differences of the pairs in data1. Let T and ST represent the mean and standard deviation of the observations in Sample
![]()
![]()
![]()
1 in data2. Define N and SN similarly for the Sample 2 observations in data3. Additionally, let nH denote the harmonic mean of n2 and n3. Then, Kim et al.’s modified t statistic [KKL+ 05] is
given by:

Note that the distribution of T3 approximately follows a standard normal distribution under the null hypothesis [KH13]. Therefore, p-values and confidence intervals can be obtained from the value of T3 .
4.2 Looney and Jones’s Corrected Z Test
Let T* and ST(*) denote the mean and standard deviation, respectively, of the observations in Sample
1 in the combined data of data1 and data2. Similarly, define N* and SN(*) for the Sample 2
observations in the combined data of data1 and data3. Moreover, let STN1 be the sample covariance of the pairs in data1. Then, Looney and Jones’s corrected Z test [LJ03] is given by:
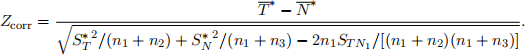
The distribution of Zcorr follows a standard normal distribution under the null hypothesis. Therefore,p-values and confidence intervals can be obtained from the value of Zcorr.
5 Grading Rubric
The project will be evaluated based on the following criteria:
1. Correctness (40 points): The function should compile without errors and produce accurate analysis results for all test cases. Failure to compile will result in a grade of zero for this criterion.
2. Completeness (30 points): The function should handle all possible cases of partially matched samples, including complete matched samples, and provide appropriate implementations for each case.
3. Readability (10 points): The code should be well-organized, with meaningful variable names and consistent indentation. It should be easy to read and understand.
4. Documentation (5 points): The code should be appropriately commented, explaining the purpose and functionality of the code. Comments should be clear and concise.
5. Modularity (10 points): The function should be decomposed into logical and reusable units, avoiding unnecessary repetition of code.
6. Efficiency (5 points): The code should efficiently manage both time and memory resources without sacrificing readability and understandability.
7. Bonus (10 points): Extra credit will be given for any additional functionality or innovative ideas implemented in the function, such as the use of the htest class or exceptional error handling.
References
[KH13] Pei Fen Kuan and Bo Huang, A simple and robust method for partially matched samples using the p-values pooling approach, Stat Med 32 (2013), no. 19, 3247–3259.
[KKL+ 05] Byung Soo Kim, Inyoung Kim, Sunho Lee, Sangcheol Kim, Sun Young Rha, and Hyun Cheol Chung, Statistical methods of translating microarray data into clinically relevant diagnostic information in colorectal cancer, Bioinformatics 21 (2005), no. 4, 517–528.
[LJ03] Stephen W Looney and Peter W Jones, A method for comparing two normal means using combined samples of correlated and uncorrelated data, Stat Med 22 (2003), no. 9, 1601–1610.
2023-11-30
Statistical Methods for Partially Matched Samples