CSMMA21 ASSIGNMENT
Hello, dear friend, you can consult us at any time if you have any questions, add WeChat: daixieit
CSMMA21
ASSIGNMENT
Due in by 12:00pm (mid-day) Wednesday 6th December 2023.
The assessment has two parts. You are required to submit separate files for the two parts of this assessment.
In particular, you should submit the following four (4) files:
1. A single .pdf file containing your complete solutions to the Part 1 questions (Questions 1 - 6), including ALL relevant R code and output, and any handwritten work.
2. A single annotated .R file that includes all R code used to produce your solutions to Part 1 questions (Questions 1 - 6).
3. A single .pdf file containing your complete solutions to the Part 2 questions (Questions 7 - 12), including ALL relevant R code and output, and any handwritten solution(s).
4. A single annotated .R file that includes all R code used to produce your solutions to Part 2 questions (Questions 7 - 12).
I should be able to run the commands in the .R files to reproduce the output in the .pdf files.
Annotated R code and output will count for a maximum of 70% of the total marks available.
Part 1
Question 1
a) Cleary showing your calculations, work out by hand the lower triangular matrix L in Cholesky’s decomposition of the matrix,
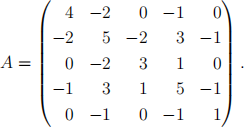
b) Next, write your own R function to produce the lower triangular matrix L in Cholesky’s decomposition of an arbitrary n 根n positive definite, symmetric matrix. No marks will be awarded if your function incorporates existing R functions for Cholesky’s decomposition.
Use your function to check your answer in part (a). [8 marks]
Question 2
a) Cleary showing your calculations, workout by hand the singular values and the matrices in the singular value decomposition of 
b) Write R code to check your answer in part (a) and comment on any differences between your answer in part (a) and the R output. [6 marks]
Question 3
Consider a system with differential equation given by
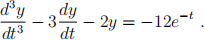
a) Determine the transient and steady state solutions for y, and hence find the particular solution if y = 0,  = 1 and
  = 8 at t = 0.
b) Next, use R to obtain a numerical solution of the above differential equation and print out graphs showing the theoretical and numerical solutions for t in the interval (0, 5).
Comment on the graphs obtained. [9 marks]
Question 4
Consider an island occupied by people whose primary source of food is fish and assume that the fishing methods are unchanged over time. Let x(t) be the fish population and y(t) that of the humans at time t and suppose that the rate of change in the two populations at time t is given by

where a,b,c,d,g are constants.
(a) Write R code to solve this system of equations.
(b) Using time increments of 0.001, run you code to obtain the numerical solution for time t in the interval (0, 5) when a = 5, b = 0.01, c = 100, d = 0.01, g = 0.0001, and given that x = 10000 and y = 60 at time t = 0 and construct plots showing how the human population change with the fish population and how both populations change over time.
Comment on your plots.
(c) Find the values of x and y for which the system achieves equilibrium.
(d) The parameter b in the above system of differential equations quantifies the decline in fish population due to human activity. Write R code to find the mimimum value for b, correct to 3 decimal places, at which the human population dies out (y < 1) and state this value.
HINT: This value for b is in the interval (0.2, 0.4). Write code to search over this interval. [10 marks]
Question 5
(a) Produce a plot of the function

for −4.5 ≤ x,y ≤ 4.5.
(b) Next use the optim function in R to find all the critical points of the function in part (a), and for each critical point, determine whether it is a local minima, maxima or a saddle point. [7 marks]
Question 6
(x1)
Consider the vector x = ' x2 ' of three observations and let
(x3 )
![]() eα1(T)x eα2(T)x
eα1(T)x eα2(T)x
1 + eα1 x 1 + eα2 x
(α 1,1 ) (α 1,2 )
where α1 = ' α2,1 ' and α2 = ' α2,2 ' are vectors of unknown constants. Also define,
(α3,1 ) (α3,2 )
T1 = (β1,1 β2,1 ) (z2(z1)) and T2 = (β1,2 β2,2 ) (z2(z1)) ,
where β1 = (β(β)2(1)1(1)) and β2 = (β(β)2(1)2(2)) are also vectors of unknown constants, and let
f1 (x) = ![]() and f2 (x) =
and f2 (x) = ![]() .
.
(a) Show that we can write
∂ ![]()
![]() l(x)) =〈
l(x)) =〈![]()
![]()
![]()
![]() )1
)1![]() (x(fl))(x)) if(if) l(l)
(x(fl))(x)) if(if) l(l) ![]() k(k)
k(k)![]() for k = 1, 2.
for k = 1, 2.
(b) Suppose R = − [(1 − y)log f1 (x) + ylog f2 (x)].
(i) Show that for k = 1, 2;
![]() βk(R) = ( − 1)k [(1 − y)f2 (x) − yf1 (x)] (z2(z1)) .
βk(R) = ( − 1)k [(1 − y)f2 (x) − yf1 (x)] (z2(z1)) .
(ii) Also show that for s = 1, 2,
![]() =
= ![]() ( − 1)k [(1 − y)f2 (x) − yf1 (x)]βsk
( − 1)k [(1 − y)f2 (x) − yf1 (x)]βsk ![]() x.
x.
[10 marks]
Part 2
Question 7
Suppose that the photographs of n famous film actors are paired randomly with n pho- tographs of the same actors taken when they were babies.
Write an R function that replicates this experiment 100, 000 times and returns an estimate of the probability that at least one actor will be correctly paired with this actor’s own baby photograph.
Run your function for n = 2, 3, 4, . . . , 14, 15 and produce a plot of the estimated probabilities obtained against n. Comment on any interesting features of your plot. [4 marks]
Question 8
The following figure shows 3 faces from a face database.

The files can be found in Blackboard under Assignments.
a) Calculate the average of the three faces, and plot an image of it.
b) Also, plot images of the difference of each face from the average face on one figure.
c) Based on the covariance matrix of the differences, calculate eigenfaces (equal to eigenvec- tors) and plot images of the first 3 eigenfaces. [3+3+4=10 marks]
Question 9
Write a function to generate m datasets, each of sample size nn, from a binomial distribution with p = 0.01 and trial size 10 and to calculate the mean of each dataset.
Do not write loops in R to generate the m datasets and to calculate the means. Instead, use either the apply or colMeans functions to achieve this objective.
Next, use your function in the apply function to generate
(a) 10000 sample means, each mean being calculated from a sample of 20 random numbers from a binomial distribution with p = 0.01 and trial size 10, and
(b) 10000 sample means, each mean being calculated from a sample of 100 random numbers from a binomial distribution with p = 0.01 and trial size 10.
Plot histograms showing the distributions of sample means for each sample size (20 and 100) on the same figure.
Compare the two plots, using the Central Limit Theorem to explain your findings. [3+3=6 marks]
Question 10
Write R code to generate a random sample x of size 20 from a normal distribution with mean of 100 and standard deviation of 4. Next, generate a variable y = 2 + x + ϵ, where ϵ represents noise on the data which is normally distributed with a mean of zero and a standard deviation of 1. You have just generated 20 pairs of data, with each element in y associated with the corresponding element in x by adding a number 2 with some uncertainty due to noise.
Plot the points x and y superimposed on the same graph and draw lines showing their means, ensuring that you get all datapoints on the graph.
Use the two-sample t test in R to test if the means of X and Y are significantly different at 5% level of significance.
Also, use the matched pairs t test for the same hypothesis test and comment on the difference in the conclusions from the two tests.
Which of the two tests is appropriate for this data? Explain. [4 marks]
Question 11
Multiple linear regression solves the minimisation problem
min β0 ,β1 ,...,βp (y − Xβ)T (y − Xβ) = min β0 ,β1 ,...,βp
![]() (yi − β0 −
(yi − β0 − ![]() Xij βj )2 ,
Xij βj )2 ,
where the vectors β = (β0 β1 ... βp )T , y = (y1 ... yn )T and X is an n × (p + 1) matrix with ith row (1 xi1 ... xip ) ;i = 1,...,n. The minimizer of the above problem w.r.t β is the quantity
Given an ×1 non-negative weight v![]() c(L)t(S)or(=)
c(L)t(S)or(=)![]()
![]()
![]()
![]() 2(T)
2(T)![]() ...,wn )T , the weighted Ridge regres-
...,wn )T , the weighted Ridge regres-
sion adds an ℓ2 penalty to the weighted multiple linear regression minimization problem. In particular it solves
min β0 ,β1 ,...,βp l ![]() wi (yi − β0 −
wi (yi − β0 −
![]() Xij βj )2 + λβT β].
Xij βj )2 + λβT β].
(a) Show that the weighted ridge regression estimatesβ(ˆ)WR can be obtained from the multiple
linear regression estimates if we take a necessary transformation on X,y and we augment the transformed matrix X with p+1 additional rows √λI, where I is the (p+1) × (p+1) identity matrix, and we augment the transformed vector y with p + 1 zeros.
(b) Use the lm function to write an R function that produces the weighted ridge estimates for arbitrary values of λ, weight vector w, vector y and matrix X . [4+4=8 marks]
Question 12 (Mixed bag questions)
(A) You went for a walk on the campus. There is a coffeehouse and the location is such that it can be only visited by Math-PhD students or Business school students. There you met Bo. You noticed that Bo is very shy. Suppose the probabilities that a randomly chosen student from a Math-PhD background or a Business school background is shy; ![]()
![]() .
.
❼ Bo is from Math-PhD background or from Business school background - which one is more probable and why?
❼ Suppose further it is known that the ratio of total number of students from Math- PhD background and Business school background is 2 : 11. Does your conclusion change about Bo and why? [1+2=3 marks]
(B) Harry is climbing a staircase with 30 steps in total to reach the top. Each time Harry can either climb 1, 2, or 3 steps (called by him as a single, a double, and a triple respectively). Harry was considering all possible distinct ways equally likely to climb the top using permutations of singles, doubles, and triples (the order is important).
(a) What is the probability that Harry finished climbing by taking a triple (or 3-steps)?
(b) What is the probability that Harry took
a double (2-steps) for going from 18-th to 20-th step, and
a triple (3-steps) for the final 28-th to 30-th step?
Express the probabilities up to 5 decimal places in both questions. [3+4=7 marks]
(Hint: Write an R code to find how many distinct ways can Harry climb the n steps. Using that find the numerator and denominator of the probability expression using the classical interpretation and appropriate counting rule.)
(C) Based on the Defaultnew dataset (as a .csv file given in the assignment folder) answer the following questions:
(a) What is the average income of the students who defaulted? Compare this number with the average income of the non-students who defaulted. (Mention the R code along with the answer)
(b) Next year it is expected that the balance variable of the students will increase by 4%. Using the logistic regression one may model the default probability with respect to other variables (such as income, balance etc.) jointly for the students. What will be the change in default probability for the students with (income, balance)=(17500, 970) due to the aforementioned increment in the balance variable? (Hint: Express the default probability P as a function of the balance variable Xbalance and income variable Xincome for the students under logistic regression setup
and express P(dP) in terms of X bal(dX ba)anc(lan)e(c)e . It is given that X balanc(dX balan)e(c)e is 4%, sousing the esti-
![]() form.) [(2+2)+4 =8 marks]
form.) [(2+2)+4 =8 marks]
2023-11-29