Database Theory & Analytics DTA(M)
Hello, dear friend, you can consult us at any time if you have any questions, add WeChat: daixieit
Database Theory & Analytics DTA(M)
Database in Practice 2024
Task 1: Advance Analytics SQL Operators [Marks: 20]
In this task, you are about to investigate the advanced analytics SQL window functions, and specifically the operators OVER and PARTITION BY. Briefly, the window operator defines subsets of rows in a relation, where you apply analytics functions over the rows therein. These operators are mostly adopted for analytics queries over time-dependent rows, like time-series data coming from e.g., stock market, inflation rates, parking occupancy rates in a smart city, sensor measurements, etc. The window functions extend the functionality of the aggregation functions defined by GROUP BY statements, where the latter statements cause rows to be grouped into a single output row.
Refer to the documentation of the window functions from PostgreSQL:
https://www.postgresql.org/docs/current/tutorial-window.html
and the specification of the OVER with ORDER BY and PARTITION BY operators from the SQL ‘evolution’:
• https://modern-sql.com/caniuse/over_partition_by
• https://modern-sql.com/caniuse/over_order_by
In addition to the PARTITON BY, the OVER operator is used for creating frames over data (normally, time-series data). Specifically, a frame limits the scope of the window functions to the rows between the specified range of rows relative to the current row. Processing and analytics operators are applied over the rows within the frame. Refer to the use of framing using OVER:
• https://modern-sql.com/caniuse/over_range_between_(datetime)
Your task is to understand the use of the window function (application of the PARTITION BY along with the operator OVER) and then compare its functionality with the GROUP BY operator. Provide a slide- deck, around 4-6 slides (e.g., in a .ppt or .pdf file), like a short tutorial (use your imagination for the slide design/format), that shows (i) the difference between GROUP BY and PARTITION BY operators and (ii) an example of yours about how to use OVER with ORDER BY and PARTITION BY operators. You can use any database schema and tuples for showing the functionality of the OVER/PARTITION BY and the fundamental difference with the GROUP BY operator.
Task 2: Analytics SQL Statements [Marks 80]
Read the mini tutorial in Note 5 (end of this file) about how to upload/import a CSV file into a Table via pgAdmin4.
Task 2.1. [Marks 30]
You are a data scientist1 in Meta Platforms, Inc. (META2) (former Facebook), Menlo Park, CA, and are asked to analyse the trend of the ‘closing value’ of the Meta stock prices for a year. Specifically, you access the financial Meta stock price time series, which can be found here:
https://finance.yahoo.com/quote/META/
and download the values of the stock from 23/08/2022 to 22/08/2023. For your convenience, the spreadsheet is provided to you in the META.csv file (downloadable from the Moodle). The spreadsheet has the following columns: [DATE], [Open Stock Value], [High Stock Value], [Low Stock Value], [Close Stock Value]. Import the META.csv file to a relation in PostgreSQL, e.g., metastock, with columns:
• daterec of data type Date
• openrec of data type Real
• highrec of data type Real
• lowrec of data type Real
• closerec of data type Real
As analyst, you focus on the closerec stock value. Your task is to provide the moving average of the stock closing value at every day, given the close stock values of the last N days including the current one. You are asked to calculate this N-day moving average for each day from 23/08/2022 to 22/08/2023.
For instance, for N = 3, we obtain the 3-day moving average as follows:
Date Closerec 3-day Moving Average (3DMA)
1. "2022-08-23" "161.11" "161.110000610352"
2. "2022-08-24" "163.26" "162.184997558594"
3. "2022-08-25" "168.78" "164.383331298828"
4. "2022-08-26" "161.78" "164.60666402181"
5. "2022-08-29" "159.17" "163.24333190918"
6. "2022-08-30" "157.16" "159.370000203451"
7. "2022-08-31" "162.93" "159.753331502279"
8. "2022-09-01" "165.36" "161.816665649414"
In row 1, the 3DMA is the same as the Closerec since we do not have information prior to this date. In row 2, the 3DMA is simply the average of the Closerec values from rows 1 and 2, i.e., (161.11+163.26)/2 = 162.18. From row 3 and onwards, we can obtain the 3DMA as the average of the Closerec of rows 1, 2, and 3, i.e., (161.11+163.26+168.78)/3 = 164.38. For row 4, the 3DMA is: (163.26+168.78+161.78)/3 = 164.60, and soon.
Given your study from the Task 1 on the OVER, ORDER BY and framing, write a SQL analytics statement where in the results you provide the date (daterec), closing stock value (closerec), 3-day moving average of the closing stock value, and 20-day moving average of the closing stock value.
Once you get these results, plot in the same figure the close stock value, the 3-day moving average, and the 20-day moving average, providing some insights from this processing (1 paragraph is absolutely fine). You can use e.g., the plotting lines tool from MS Excel, or https://chart- studio.plotly.com/create/#/, or any other tool you prefer.
Task 2.2 [Marks 50]
You are an analyst appointed by the Birmingham City council. Birmingham has established a smart Internet of Things (IoT) city infrastructure for monitoring the number of vehicles parked in different areas of the city using sensors mounted on the tarmac surface in each parking bay area. These sensors (Parking Lot Sensors; see figure) are capable of detecting and reporting parking space occupancy in real time. This infrastructure enables tracking of space usage to reduce the time hunting for a space. As analyst, you have access to this information for each parking area. A parking area is identified by a parking code, maximum capacity of parked vehicles, current number of parked vehicles at specific time instance/stamp, and the corresponding timestamp of this occupancy. For instance, a fragment of a real dataset for the Birmingham city is:

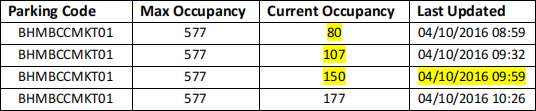
E.g., row 1 refers to the current occupancy (80 vehicles) of the parking area with code BHMBCCMKT01 (which has maximum occupancy 577 vehicles) recorded on the 4th of October 2016 at 8:59am in the morning. For your convenience, the Birmingham spreadsheet is provided to you in the PARKING.csv file (downloadable from the Moodle). The spreadsheet has the following columns: [Parking Code], [Max Occupancy], [Current Occupancy], [Last Updated]. Import the PARKING.csv file to a relation in PostgreSQL, e.g., parking, with columns:
• parkingcode of data type Varchar
• capacity of data type Integer
• occupancy of data type Integer
• lastupdated of data type Timestamp without time zone
In row 3 (timestamp: 04/10/2016 09:59), the e.g., 3-timestamp moving average of the occupancy is the average of the current and the most recent two occupancy values, i.e., (150+107+80)/3 = 112.33. Moreover, in row 3 (timestamp: 04/10/2016 09:59), the e.g., 3-timestamp running total of the occupancy is the summation of the current and the most recent two occupancy values, i.e., 80+150+107 = 337. In row 4 (timestamp: 04/10/2016 10:26), the 3-timestamp running total of the occupancy is the summation of the current and the most recent two occupancy values,i.e., 107+150+177 = 434, and soon.
Given your study from Task 1 on OVER, PARTITION BY, ORDER BY, and framing, provide a SQL analytics statement of the following processing: For the specific duration: from '2016-10-07 00:00:01' to '2016- 10-07 23:59:59', your task is to provide for each parking area the current occupancy, the last updated time, the 4-timestamp moving average of the occupancy, and the 4-timestamp running total.
Once you get these results, for only three parking areas (choose whichever you prefer), plot in the same figure their 4-timestamp running totals and provide some insights from this processing. You can use e.g., the plotting lines tool from MS Excel, or https://chart-studio.plotly.com/create/#/ , or any other tool you prefer.
Notes & Submission
Note 1: Your answered statements are marked against correct SQL syntax and rationale, i.e., the provided SQL query indeed reflects its description.
Note 2: The Assessed Coursework is graded out of 100 Marks: Task 1 [20 marks] and Task 2 [80 marks].
Note 3: Answer ALL tasks.
Note 4: Submit a document including your details and all answers in one PDF document file (put any filename you desire) and one document file of your slide-deck/presentation (either .PPT or .PDF) of Task 1.
Note 5: CSV File Loading in PostgreSQL using pgAdmin4
Step 1: Create a TABLE with the same attributes and corresponding domains as the columns of the .csv file. E.g., if the csv file consists of the attributes: AGE (Integer) and NAME (Varchar(10)), then, we create the table: CREATE TABLE MYTABLE (AGE INTEGER,NAME VARCHAR(10));
Note: the order of the attributes in the table should be the same as the order of the columns in csv file.
Step 2: Right click on the recently created table ‘mytable’ in phAdmin4 and select ‘ Import/Export’ data. In the ‘Option’ tab, select ‘ Import’ and provide the filename of the csv file, e.g., ‘ names.csv’ . Make sure in the ’Select File’ the format is ‘CSV’ . Then ‘Ok’, and that’s all. Always check that the data have been
populated using e.g., SELECT * FROM MYTABLE
More information:
https://www.postgresqltutorial.com/postgresql-tutorial/import-csv-file-into-posgresql-table/
2023-11-29
Database in Practice 2024