COMM1190: DATA, INSIGHTS, AND DECISIONS PRACTICE QUESTIONS
Hello, dear friend, you can consult us at any time if you have any questions, add WeChat: daixieit
COMM1190: DATA, INSIGHTS, AND DECISIONS
PRACTICE QUESTIONS
QUESTION 1 (30 marks)
PART A 18 MARKS
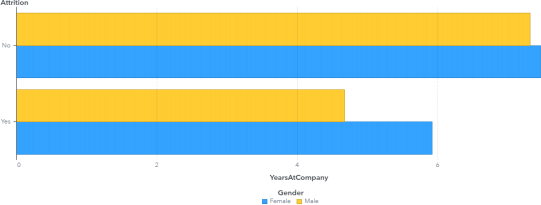
Concerning the charts below, answer all of the following questions.
a) The bar chart below presents the changes in the variable “Attrition” based on the two variables “Yearsatcompany” and “Gender”. Summarise two facts based on your interpretation of this bar chart.
Note: “Attrition” is a categorical variable (yes/no), denoting if an employee leaves the company or not; “Yearsatcompany” is a numerical variable, denoting the number of years an employee has worked at the company; “Gender” is a categorical variable (Female/Male).
[max 120 words] (8 marks)
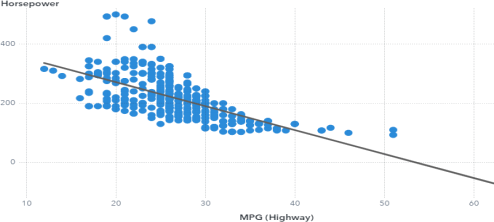
b) The scatter plot below presents the correlation between the horsepower of a car and its capacity to travel on the highway. Based on the chart, formulate a descriptive problem, a predictive problem, and a prescriptive problem that can be addressed using the scatter plot below. Note: “Horsepower” denotes the power that a car engine produces; “MPG(Highway)” denotes how far a car can travel for every gallon of fuel it uses on the highway.
[max 180 words] (10 marks)
PART B 12 MARKS
Which features of this graph are redundant or irrelevant?
[max 200 words]

QUESTION 2 (35 marks)
PART A 16 MARKS
You are examining the relationship between the concentration of substance A from measurements of peak area and the percentage of colour B. You have observed the following data points: (x_i, y_i) where i=1,2,…,n, and x_i and y_i represent the percentage of colour B and the concentration of substance A, respectively. Here, 0 ≤ x_i ≤1 and x_i=0.5 means that the percentage of colour B is 50%.
Concerning the information above, answer all of the following questions.
a) Suppose you want to fit a simple linear regression model to the dataset by treating the percentage of colour B as the predictor and the concentration of substance A from measurements of peak area as the response. Write down the mathematical equation of a simple linear regression model. (3 marks)
b) The following table presents some of the statistics from the above fit (the linear regression model):
|
|
Coefficient Estimate |
Standard Error |
t-statistics |
p-value |
|
Intercept |
0.0729 |
0.0279 |
2.6129 |
0.017 |
|
Percentage of Color B |
10.77 |
0.27 |
39.8889 |
0.000 |
If you want to test whether there is a relationship between the predictor (Percentage of Color B) and the response (Concentration of Substance A from Measurements of Peak Area), what is the null hypothesis, and what is your conclusion based on the output in the above table? Justify your conclusion.
[max 60 words] (4 marks)
c) Based on the output in the table in Q2b), provide an interpretation of the coefficient associated with the Percentage of Colour B.
[max 50 words] (3 marks)
d) To assess the quality of the fit of the linear regression model, you want to examine whether the residuals for the data on the concentration of substance A from measurements of peak area follow a normal distribution. Name one graphical method from this course that you can use to perform this task and briefly describe in words how you can visually check this.
Note: residuals refer to the differences between the observed values and the fitted values using the above linear regression model.
[max 60 words] (3 marks)
e) There are two samples: the percentage of colour B in sample 1 is 10% and the percentage of colour B in sample 2 is 50%. Compare the average concentration of substance A from measurements of peak area in the two samples by calculating the ratio of them based on the fitted linear regression model. (3 marks)
PART B 19 marks
A medical experiment has been carried out to build a model for predicting a deformation D in young patients after a certain type of medical surgery. The dataset includes the following information for each patient under study: D deformation (deformation or normal), Age (in months), Number (the number of parts involved), and Position (the position of the topmost part operated on).
Concerning the information above, answer all of the following questions.
a) Suppose you want to fit a logistic regression model with three predictors: Age, Number, and Position. Write down the mathematical equation of the logistic regression model. (3 marks)
b) You are given the following output after fitting the logistic regression model in Q3(a).
|
|
Coefficient estimate |
|
Intercept |
-2.04 |
|
Age |
0.01 |
|
Number |
0.41 |
|
Position |
-0.21 |
Explain whether you predict that a young patient with the characteristics (i.e., Age =1, Number =2, Position = 10) will have deformation D.
[max 80 words] (4 marks)
c) Suppose you also fitted the classification tree below:
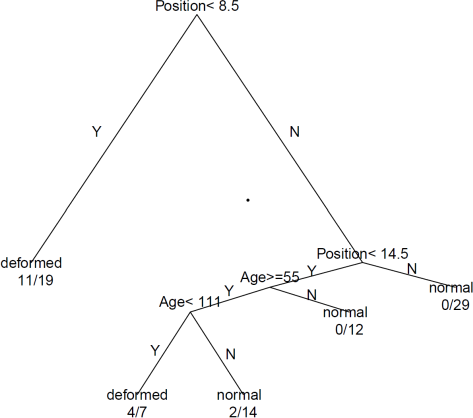
Based on the above classification tree, would you predict a young patient with the following characteristics (i.e., Age =1, Number =2, Position = 10) will have deformation D? Justify your answer.
[max 60 words] (3 marks)
d) Using the table in Q3b) and the graph in Q3c), comment on the consistency of results from the logistic regression and the classification tree from two aspects.
[max 80 words] (4 marks)
e) The tables below show the confusion matrices for the classification tree and the logistic regression. Compare the two classification approaches by making full use of the confusion matrices and explain which approach you would prefer for predicting D deformation in young patients.
Classification tree
|
|
Predicted Normal |
Predicted Deformation |
|
Actual Normal |
53 |
11 |
|
Actual Deformation |
2 |
15 |
Logistic regression
|
|
Predicted Normal |
Predicted Deformation |
|
Actual Normal |
52 |
12 |
|
Actual Deformation |
10 |
7 |
[max 100 words] (5 marks)
Question 3 35 MARKS
A multinational hotel and resort group has recently opened three new holiday resorts in Australia. They are Resort A, Resort B, and Resort C. The business plan was to position the resorts as “upmarket” complexes with a range of facilities, including spas, boat and bike hire, beauty and massage services, restaurants, and a small range of boutique shops. Customers would be charged separately for these extra services if they used them, and the plan was to generate considerable revenue over and above the accommodation charges. The Head Office of the company has decided to explore different ways to promote this type of extra spending but has left it to the resort managers as to how they gather relevant evidence. Ultimately, Head Office will decide on how promotion is best achieved based on the evidence from each of the resorts.
Two modes of promotion are being considered. Call these treatments BOOK and TV:
• BOOK: customers are provided with a glossy booklet explaining the available facilities when they first check in to a resort;
• TV: whenever the television in their rooms is turned on, and before customers could watch anything else, advertisements would run providing the same information contained in the booklet.
Regarding the information above, answer all of the following questions.
a) In Resort A, the manager decides to use two one-month periods to gather evidence. In the first one-month period, all customers are allocated to the BOOK treatment. In the second one-month period, all customers are allocated to the TV treatment. The key outcome, denoted by Expend, is defined as the total amount of dollars spent per booking per day over and above accommodation. At the end of the second period, the manager calculates the difference in means of Expend for customers in the two treatments. Explain why this may not be a good approach to estimate the difference in the causal effects of the two treatments on Expend by including at least two criticisms.
[max 200 words] (8 marks)
b) In Resort B, the manager decides that all customers, over one month, are allocated to either the BOOK or TV treatment depending on whether their booking number is odd or even. Define Bkdi to be a dummy variable equal to 1 if the ith customer was allocated to the BOOK treatment and equals zero if they were in the TV treatment. Consider the regression Expendi = β0 + β1 Bkdi + ui. Using data on the 200 customers who stayed at Resort B over the one month of the experiment produces OLS estimates for this model given below.
How do you interpret the magnitudes of the estimates of β0 and β1 ? Is the estimate of β1 statistically significant? Provide an overall interpretation of the difference between the treatments, BOOK, and TV, that would be suitable for reporting to senior management.
Note: The 97.5th percentile of a standard normal distribution is 1.96.
equalExpen(̂)di = 2![]()
![]() − 2
− 2![]() 2(7)
2(7)![]() kdi
kdi
n = 200, R2 = .048, standard errors in ( . )
![]() [max 200 words]
[max 200 words]
c) In Resort C, the manager uses the same approach as in Resort B, except that the allocation to either the BOOK or the TV treatment was decided by check-in staff when a customer arrived. The table below provides the sample means, separately for the two treatment sub-samples, for the 398 customers who stayed at Resort C over the one month of their experiment.
i. Use these sample means to estimate β1 .
[max 50 words] (2 marks)
ii. Based on the sample means for the customer characteristics, discuss whether you think randomization into the two treatments was successful or not.
[max 80 words] (3 marks)
iii. Use this discussion to provide an argument for why the difference in the causal effects of the two treatments on Expend is possibly biased using the Resort C approach.
[max 80 words] (3 marks)
Table: Sample means for key variables divided into the two treatment groups
|
Variables and definitions |
BOOK |
TV |
|
BKd = 1 if assigned to BOOK, =0 if assigned to TV |
1.00 |
0.00 |
|
Income = 1 if family income > $100,000, = 0 otherwise |
0.68 |
0.79 |
|
People Number of people in the booking party |
3.53 |
4.42 |
|
Length Length of stay in days |
4.68 |
4.81 |
|
Age Age in years of the person making the booking |
47.2 |
47.8 |
|
Expand Expenditure ($) per booking per day over & above accommodation |
231.8 |
273.2 |
|
Observations |
178 |
220 |
d) In reviewing the results for Resort B, Head Office is surprised that no other controls were included in the regression reported in Q5b). In particular, they note that the correlation of 0.61 between the number of people in the booking party and Expend is positive as expected and quite strong. Explain to Head Office why you think this is not a problem in interpreting the estimates of 1 obtained in Q5b) as causal.
[max 100 words] (4 marks)
e) After reviewing the evidence, Head Office decided to implement TV for all customers and advertise the facilities through the television at all three resorts. After implementing this change, the Resort B manager monitored their Facebook reviews and noticed that the negative reactions to the television advertising outweighed the positive posts. What do you think is the most likely explanation for why the experimental evidence obtained for Resort B is different from the reactions on Facebook?
[max 100 words] (5 marks)
2023-11-27