COMM1190: DATA, INSIGHTS, AND DECISION TERM 3 2021
Hello, dear friend, you can consult us at any time if you have any questions, add WeChat: daixieit
COMM1190: DATA, INSIGHTS, AND DECISION TERM 3 2021
SAMPLE EXAMINATION
QUESTION 1 30 MARKS
You have been brought in as a Data Science consultant on a court case. A chemical company
has been found negligent after a chemical spill at one of their plants. All that remains in the
court case is to decide on the extent of the damages for which the company is liable. One way the court has been deciding on this amount is to look at the impact the spill has had on the
value of houses located near to the chemical plant where the spill occurred.
As the expert witness, you have been asked to evaluate some alternative strategies to
estimate the impact on housing prices (price). Strategy A involves taking a sample of sales that occurred after the spill where the houses are classified as either being close to the plant or not. This feature was designated by a variable near that was equal to 1 if the house was deemed to be close to the chemical plant and zero otherwise. Then a regression analysis is performed using the following model (MA):
MA: PTicei = β0 + β1neaTi + ui.
Strategy B involves taking a sample of sales for houses near to the plant but where some sales occurred before the spill and some after. The variable after is equal to 1 if the house was sold after the spill and zero if the sale was before. Then a regression analysis is performed using the following model (MB):
MB: PTicei = β0 + β1 afteTi + ui.
Part A. (5 Marks)
Explain A and B as strategies to estimate the impact of the chemical spill and critically evaluate each of them. Is either preferable to the other?
Part B. (5 Marks)
Suggest an alternative regression model that is preferable to MA given that you only have data from after the spill. Does this address all your criticisms of Strategy A that you outlined in part (a)?
Part C. (10 Marks)
Using housing data models MA and MB are estimated, and the results given below. How do you interpret these results? (Note that PTice is expressed in $1000)
![]() = 131.9 − 40.0neaT
= 131.9 − 40.0neaT
(4.0) (7.6)
n = 142, R2 = .165, StandaTdeTTOTS in ( . )
![]() = 63.7 + 28.3afteT
= 63.7 + 28.3afteT
(5.9) (9. 1)
n = 96, R2 = .094, StandaTdeTTOTS in ( . )
Part D. (10 Marks)
Suppose you have sales both near and not near to the plant as well as sales before and after the spill. Suggest an alternative strategy to estimate the effect of the oil spill on housing prices that is preferable to both MA and MB?
QUESTION 2 40 MARKS
During the onset of the COVID-19 pandemic, you are a junior data analyst working for a media company in Singapore. Your boss has asked you to prepare a chart to report on the latest
numbers of coronavirus cases and newly discharged COVID-19 patients in Singapore. You
came up with two charts showing the evolution of the situation over time in terms of daily new cases and daily patients discharged.
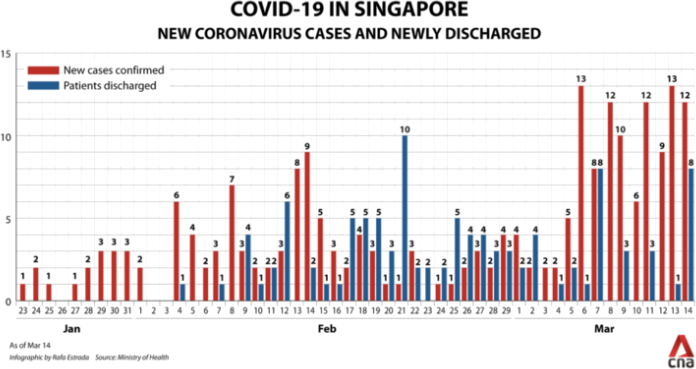
Chart 1
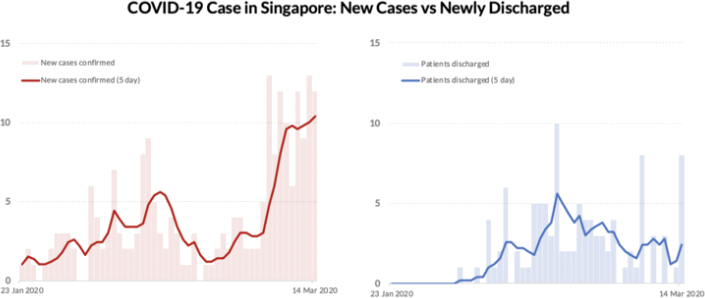
Chart 2
Part A. (15 Marks)
Which chart do you choose to present to your boss and explain what makes your choice a great chart?
Part B. (15 Marks)
Your boss followed up with another request and asked you to produce a chart that compares daily new cases in Singapore vs Australia. Sketch two alternative charts to address the request. For each chart, provide a brief explanation of your design choices. You can sketch the charts using pencils, pens or markers on paper, then take a picture of the charts and paste them into your solutions document.
Part C. (10 Marks)
Evaluate your two charts and explain which you would select to further develop to present to your manager.
QUESTION 3 30 MARKS
University students in a large class have access to all subject material online. To evaluate
whether students perform better in an end-of-term assignment if they review these materials prior to the due date of the assignment, consider the following model relating assignmaTK = the assignment mark (out of 20) to a binary indicator view = 1 if the student viewed the material online at least once:
assignmaTK = β0 + β1 view + u.
Part A. (5 Marks)
Using data on over 200 students produces OLS estimates for this model given below. What is the literal interpretation of the estimate of β1 = 0.94?
asslgnm(̂)ent = 15.17 + 0.94view
(0.30) (0.39)
n = 233, R2 = 0.72, standaTdeTTOTs in ( . )
Part B. (5 Marks)
Suppose the extended model given below is estimated, where midtest is the student’s mark on the mid-term test and female = 1 if the student is female. What is the literal interpretation of the new estimate of β1 ?
assignmaTK = β0 + β1 view + β2midtest + β3female + u
Part C. (10 Marks)
Do you believe this new estimate of β1 can be given a causal interpretation? Justify your answer.
Part D. (10 Marks)
Consider setting up an experiment to investigate the causal impact of student reviewing the relevant material online on an assignment mark. Explain whether such an experiment is feasible and if so, discuss whether it is ethical?
2023-11-27