APS 502 Computational Project Fall 2023
Hello, dear friend, you can consult us at any time if you have any questions, add WeChat: daixieit
APS 502 Computational Project Fall 2023
Instructions: This is an individual assignment. For each optimization model below you need to in your report (1) formulate the model by hand (typed is better) with all variables defined and the model objective and constraints fully written out and (2) print out the MATLAB file that contains the data (e.g. through the vectors/matrices) and call to linprog or quadprog used to compute the model in MATLAB and the output from calling linprog or quadprog that shows the optimal values for the variables and objective function values.
Do not just dump the MATLAB file, comment it and highlight the optimal values and highlight the important quantities like the optimal variance or optimal cost and make your results easy to see from my point of view. Neat and well organized reports are valued more than sloppy and difficult to read reports! You must use the MATLAB linprog and quadprog functions but you can call the function from python in which case you must print out your python code. Due Dec 8 by 5PM. Slide your report under my door at MC 320. Late assignments will incur penalty.
Problem 1
Part 1 (Cash Matching)
Formulate a linear programming model and solve using MATLAB or Python to find the lowest-cost dedicated bond portfolio that covers the stream of liabil-ities given in the table below (allow cash to be carried forward at the forward rates that are consistent with the spot rates s1 = 5:04%; s2 = 5:94%; s3 = 6:36%; s4 = 7:18%; s5 = 7:89%; s6 = 8:39%):

with the set of bonds below:
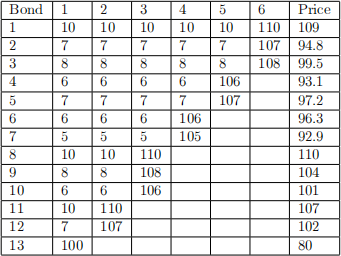
(a) What is the cost of your portfolio? How many units of each bonds are in your portfolio?
(b) Now repeat part (a) but now the number of units of Bond 13 is re-stricted to no more than 10% of the total units of bonds purchased. Discuss the differences between the portfolio from (a) and (b).
Part 2 (Optimal Immunization)
Now formulate a linear programming model and solve using MATLAB or Python to find the lowest-cost bond portfolio (using the same bonds in Part 1) that matches the present value of the liabilites and dollar duration of the liabilities. The dollar duration (DD) of a stream of liabilities (l1; l2; :::; lm) is
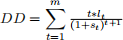
(Note: Use the given spot rates to compute the PV of liabilities). What is the cost of your portfolio and compare with the cost from Part 1. How many units of each bond are in your portfolio and compare with the portfolio from Part 1?
Problem 2
PART 1
You will use the following three ETFs (exchange-traded funds) to form a portfolio of these three assets. An ETF operates just like a stock, but these assets represent market indices or broad set of securities (stocks or bonds). For example, the purchase of one share of SPY (see below for description) represents an investment into the 500 stocks in the S&P 500.
(1) SPDR S&P 500 ETF (SPY), this is a fund that mimics the perfor-mance of the S&P 500 which is a well known market index consisting of 500 large capitalization stocks from the U.S.
(2) iShares Core US Treasury Bond (GOVT), this is a fund that mimics the performance of a wide set of U.S Treasury bonds.
(3) iShares MSCI Emerging Markets Mini Vol (EEMV), this is fund that mimics the performance of emerging market stocks but with lower volatility compared to other emerging market funds.
Tasks
(a) Use yahoo (e.g. yahoo.com or yahoo.ca) finance to get the monthly adjusted closing prices of SPY, GOVT, and EEMV from Jan 2015 to end of Oct 2023 and compute the expected returns of the three assets, the standard deviations of the three assets as well as the co-variances between all assets over this time period. Show and highlight these parameters in your report but you donít have to show the monthly prices or the computations that you did to get the parameters.
(b) Use the mean-variance optimization model to generate an efficient fron-tier of the three assets. Create a table where for each expected return goal R show the optimal weights of the assets as well as the portfolio variance value. Also, plot the efficient frontier. Note: the range of R can be the smallest positive expected return among the three assets to the largest expected return among the assets. You are free to choose the points in the range to use for the optimizations but they should be at least 10 return points equally spaced out.
Note: A formula sheet will be posted on the quercus that you can use to get the parameters for PART 1 from the monthly adjusted closing prices. To compute a historical monthly return for a particular month use the adjusted closing price of the last trading day of the month and use the adjusted closing price of the last trading day of the previous month.
For example, if the adjusted closing price of the last trading day in January 2018 for a stock was $60 and the adjusted closing price of the last trading day of February 2018 was $67, the monthly return for February is 11.67 percent [(67/60)-1] * 100.
PART 2
Repeat (b) of PART 1 using the stocks SPY, GOV, EEMV as well as the stocks below (so portfolios will have 8 assets now) that have heavy involvement and connection to development or use of blockchain technology (some people think that these stocks are going to do well in the future)
(4) CME Group (CME)
(5) Broadridge Financial Solutions (BR)
(6) Cboe Global Markets (CBOE)
(7) Intercontinental Exchange (ICE)
(8) Accenture (ACN)
2023-11-22