BE334: FINANCIAL MARKETS AND MONETARY POLICY
Hello, dear friend, you can consult us at any time if you have any questions, add WeChat: daixieit
BE334: FINANCIAL MARKETS AND MONETARY POLICY
CW 1 - AU 23, WEIGHTING 30%
STUDENTS PLEASE NOTE:
Your work should be uploaded to FASER in one of these two formats only, either a PDF.doc or WORD.doc
Any other format could result in you not receiving a mark for this piece of assessment.
QUESTIONS
By using relevant data, theoretical concepts, and models, answer the following three questions:
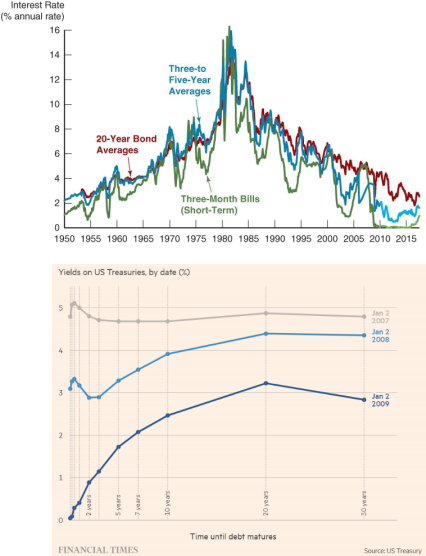
1. (30% of the total mark) Below are two examples of different government bonds in the US. Considering these examples, please list the three empirical facts that the
main theories of the term structure of interest rates try to explain. Next, provide a brief
explanation of how these theories are able/unable to explain empirical facts on interest rates. Lastly, explain the relationship between these three theories.
2. (40% of the total mark) The UK Debt Management Office (http://www.dmo.gov.uk)
provides information about all gilts in issue. The close prices have been published on
Tradeweb (https://reports.tradeweb.com/account/login/; you sign up to get a free account).
Here you are interested in two UK gilts: “0½% Treasury Gilt 2029 (ISIN: GB00BLPK7227)” and “1¾% Treasury Gilt 2037 (ISIN: GB00BZB26Y51)” .
a) Insert the screenshots of the two gilt closing prices as of 30 August 2023 from Tradeweb.
b) Using the available resources, describe the two gilts’ characteristics.
c) Calculate the yields to maturity of the two gilts. Provide details for the steps to support your calculations.
d) Plot the term structure using the two yields to maturity you calculated previously and use the theories of the term structure you learned from this module to discuss your
observed term structure.
3. (30% of the total mark) The Bank of England offers access to the mostrecent yield curves as well as to the archived data on interest rates in the past:
https://www.bankofengland.co.uk/statistics/yield-curves.
Data is obtained from the webpage. In the page, you goto “Archive yield curve data –
Monthly” -> “Monthly government liability curve (nominal): archive data”. Then you can download a zip file.
a) Plot nominal spot yield curves for UK government liabilities for the end of each
month from January 2020 to September 2023. Please use the “surface” chart type in Excel, or a similar 3D representation. Also comment on the trend of the yield curves that you observed.
b) Bank of England has raised the Bank rate 14 times in a row from December 2021: https://www.bankofengland.co.uk/boeapps/database/Bank-Rate.asp. Use the yield curve data and comment how the increase in Bank rate affects the change in short- term and long-term yield to maturity.
2023-11-20