ECON7310: Elements of Econometrics
Hello, dear friend, you can consult us at any time if you have any questions, add WeChat: daixieit
ECON7310: Elements of Econometrics
Research Project 2
Instruction
Answer all questions following a similar format of the answers to your tutorial questions. When you use R to conduct empirical analysis, you should show your R script(s) and outputs (e.g., screenshots for commands, tables, and figures, etc.). You will lose 2 points whenever you fail to provide R commands and outputs. When you are asked to explain or discuss something, your response should be brief and compact. To facilitate tutors’ grading work, please clearly label all your answers. You should upload your research report (in PDF or Word format) via the “Turnitin” submission link (in the “Research Project 2” folder under “Assessment”) by 12:00 PM on the due date October 5, 2021. Do not hand in a hard copy. You are allowed to work on this assignment in groups; that is, you can discuss how to answer these questions with your group members. However, this is not a group assignment, which means that you must answer all the questions in your own words and submit your report separately. The marking system will check the similarity, and UQ’s student integrity and misconduct policies on plagiarism apply.
A. Panel Data (60 points)
Background
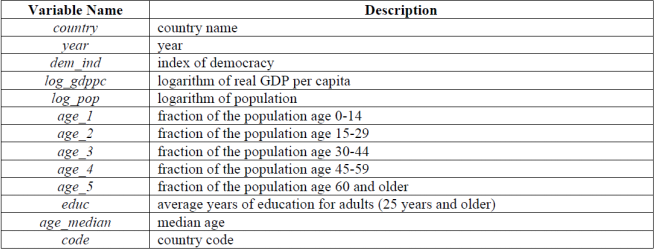
Do citizens demand more democracy/political freedom as their incomes grow? That is, is democracy a normal good? To study this issue, you will explore the dataset income_democracy.csv which contains a panel data set from 195 countries for the years 1960, 1965, ..., 2000. A detailed data description is given in the table below. The dataset contains an index of democracy/political freedom for each country in each year, together with data on the country’s income and various demographic controls. The income and all demographic controls are lagged five years relative to the democracy index to allow time for democracy to adjust to changes in these variables.
Research Questions
1. (3 points) Is the data set a balanced panel? Explain. Hint: Look through the dataset or use the is.pbalanced() function.
2. (11 points) The index of political democracy/political freedom is labeled dem_ind.
(a) What is the value of dem_ind for the United States in 2000 (1 point)? What is the average of dem_ind for the United States over all years in the data set (2 points)? Repeat this exercise for Libya (2 points).
(b) How many missing values are there for dem_ind (1 point)? List all countries with the lowest average value of dem_ind (i.e., =0) (4 points). How many countries do have the highest average value of dem_ind (i.e., =1) (1 point)? Hint: You can identify missing values using the is.na() function and compute sample average for each country using the aggregate() function.
3. (16 points) The logarithm of per capita income is labeled log_gdppc.
(a) Regress dem_ind on log_gdppc using standard errors that are clustered by country. Report your estimation results in a table similar to Table 10.1 on page 378 of SW textbook, not including the test part (3 points).
(b) Interpret the estimated coefficient on log_gdppc (2 points)? Is the coefficient statistically significant (1 point)?
(c) If per capita GDP in a country increases by 10%, by how much is dem_ind predicted to increase (2 points)? Construct a 95% confidence interval for the prediction (2 points)? Is the predicted increase in dem_ind large or small? Explain what you mean by large or small (2 points).
(d) Why is it important to use clustered standard errors for the regression (2 points)? Do the results change if you do not use clustered standard errors (2 points)?
4. (27 points) Consider panel data regressions.
(a) Suggest a variable that varies across countries but plausibly varies little (or not at all) over time and that could cause omitted variable bias in the regression in Question 3 (Q3) above (3 points).
(b) Estimate the regression in Q3, allowing for country fixed effects. Add the estimation results to the table in 3(a) (3 points). How do your answers to 3(b) and 3(c) change (2 points)?
(c) Exclude the data for Azerbaijan and re-run the regression. Do the results change (2 points)? Why or why not (2 points)?
(d) Suggest a variable that varies over time but plausibly varies little (or not at all) across countries and that could cause omitted variable bias in the regression in Q3 (3 points).
(e) Estimate the regression in Q3, allowing for both time and country fixed effects. Add the estimation results to the table in 3(a) (3 points). How do your answers to 3(b) and 3(c) change (4 points)?
(f) There are additional demographic controls in the data set. Should these variables be included in the regression? If so, re-run the regression, including these controls. Report the regression results in the table in 3(a) (3 points). How do the results change when they are included (2 points)?
5. (3 points) Based on your analysis, what conclusions do you draw about the effects of income on democracy?
B. Binary Choice Model (40 points)
Background
The Australian government passed its ✩130 billion JobKeeper package to reduce the unemployment rate during the lockdown. But, it seems that the longer this lasts, the higher the numbers of unemployment goes. You want to study what kind of workers might lose their jobs during the COVID-19 health crisis. Specifically, are young workers more likely to lose their jobs than middle-aged workers? Does their educational background help them to keep their jobs?
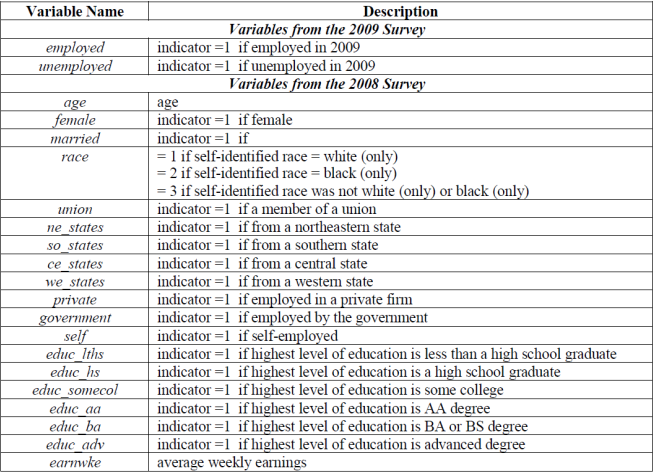
Unfortunately, you have only one dataset (i.e., US Employment 0809.csv), which contains a random sample of 5,412 U.S. workers. They were surveyed in 2008 after the global financial crisis of 2007–2008 and reported that they were employed. The data file contains their employment status (i.e., employed or not) in 2009, one year later, along with some additional variables. A detailed data description is given in the following table:
Research Questions
(a) (10 points) Using a linear probability model (LPM) to regress employed on age and age2 and report regression results (5 points). Is age a statistically significant determinant of employment (3 points)? Is there evidence of a nonlinear effect of age on the probability of being employed (2 points)?
(b) (10 points) Repeat (a) using a probit and logit regression model and report your results (6 points). Explain the difference between probit and logit model (4 points).
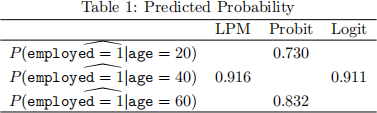
(c) (8 points) Use the models of LPM, probit, and logit to compute the predicted probability of employment for a 20-year-old worker, a 40-year-old worker, and a 60-year-old worker and fill the following table (5 points). Explain the differences in the results (3 points).
(d) (12 points) The data contains variables measuring the worker’s educational attainment, gender, race, marital status, region of the country, and weekly earnings. Repeat (a) and (b) using these factors as additional regressors and construct a table (such as Table 11.2 in SW textbook, not including the test part on page 411) (6 points). Investigate whether the conclusions on the effect of age on employment from (a) and (b) are reliable or not when including these control variables (3 points). Use the regressions in your table to discuss the characteristics of workers who were hurt most by the financial crisis (3 points). Hint: Include dummies for race groups and ln(earnwke + 1).
2021-09-26