ECON3000 Practice Questions 6
Hello, dear friend, you can consult us at any time if you have any questions, add WeChat: daixieit
ECON3000
Practice Questions 6
Question 1
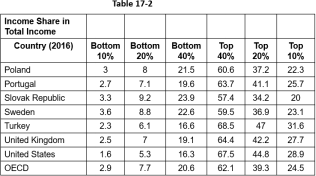
As Table 17-2 (see below) shows, members of the poorest fifth of U.S. households have a
much smaller share of total U.S. income than is typical in other developed countries. Does
this mean that the poorest fifth of U.S. households are worse off in the United States than are the poorest fifth of households elsewhere? Why or why not?
Question 2
The U.S. federal government (same as Australian) definition of poverty is the same in all communities around the country. Is this appropriate? Why or why not?
Question 3
Suppose there are two types of people in the country of Diplandia: people who value only
food, and people who value both food and movie tickets. The government of Diplandia is
considering moving from a cash-welfare system to a food stamps system. The new system
will provide the same benefit levels, but recipients will get stamps allowing them to buy food instead of cash. Explain how this change will affect the work efforts and utility levels of the two types of people in Diplandia. How do you think the change would affect the overall Diplandia economy?
Question 4
Suppose that the government currently provides everyone with a guaranteed income of
$12,000 per year, but this benefit level is reduced by $1 for each $1 of work income. The government is considering changing this policy such that the benefit level is reduced by $1 for every $2 of work income. What effect would this policy have on work effort? Explain your answer.
Question 5
Senator Ostrich suggests that “in order to end poverty, all we need to do is pay everyone making less than the poverty line the difference between what they are earning and the
poverty line.” Ostrich argues that, based on the set of people currently below the poverty line, this would cost $98 billion per year. Why is Ostrich understating the costs of this program?
Question 6
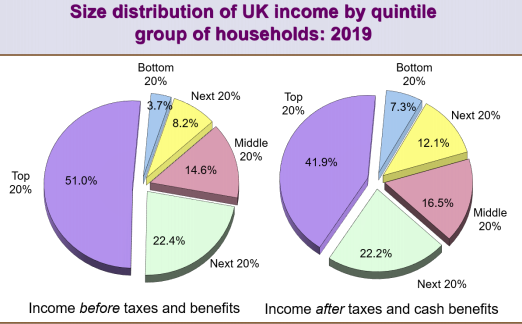
Using the data shown on the pie charts above, construct two Lorenz curves (on the same
diagram), corresponding to the before- and after-tax income figures. Interpret and comment on the diagram you have drawn.
2023-11-11