MFIN 705 Assignment 2
Hello, dear friend, you can consult us at any time if you have any questions, add WeChat: daixieit
MFIN 705
Assignment 2
Due November 10.
Hand in a pdf copy of your: 1) computer output, 2) your R code in a plain text file and 3) a separate write-up of the answers to the following questions on Avenue, Assignment 2. Each student’s write-up should be done independently.
1. Use the R command getSymbols() to obtain log-prices for the symbols AAPL, GOOG, IXIC and QQQ for the time period 2005-01-01 to 2023-09-01 from yahoo finance. Using the log-adjusted price level answer the following questions.
(a) What is cointegration and why is it useful to model it explicitly? (b) Does the log-price data contain a unit-root?
(c) Use the Johansen trace statistic with a lag order of 4 (K = 4) to test for cointegration among the series and state your conclusions. Do your results change with K = 2 or K = 6?
(d) What is the rank of the cointegrating relationships? Do any of the plots of potential cointegrating relationships look stationary?
(e) Impose the most likely rank and estimate the restricted model to identify the cointegrating vector and loading matrix. What is the interpretation of the cointegrating relationships? If you had found cointegration in price levels how would your interpretation change?
2. Consider the following GARCH model
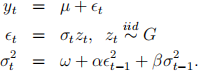
The dataset is AAPL from above andyt = 100log(pt /pt − 1 ) where pt is the adjusted daily closing price.
(a) Assuming G = N(0, 1) when is this model stationary and what conditions are necessary for positive variance?
(b) What is the news impact curve for this model and how does it differ from a GJR-GARCH model?
(c) Estimate the model for G = St(0, 1, v) where the latter denotes a Student-t distribution with mean 0 and variance v/(v − 2) assuming v > 2 by adjusting the code mle arch garch.r. Is there evidence of heteroskedasticity in the data?
 Is there fat-tails in the conditional distribution of returns?
(d) Using your estimated model compute the 1% value-at-risk and expected short- fall for a one million investment for the holding periods of i) one day ii) one week.
3. This question will use S&P 500 daily returns and the package rugarch() (see ru- garch) to select and estimate a well specified GARCH model to estimate the prob- ability that a one year investment in the S&P 500 will be greater than the one year t-bill return.
(a) getSymbols(”-GSPC ”,..) can be used to obtain S&P 500 data. What is the time span you used? Why?
(b) rugarch() allows for several different GARCH specifications including EGARCH and GJRGARCH among others. Which GARCH model did you select and why? Does it account for all autocorrelation in the conditional mean and conditional variance?
(c) Report estimates of your model and explain what they mean for S&P 500 daily returns.
(d) Compute the probability that a one year investment in the S&P 500 will be greater than the one year t-bill return using your model. How risky is this investment? Does your estimate make sense?
2023-11-10