DAT561: Midterm Project: Smart Logistic Warehouse System in Amazon
Hello, dear friend, you can consult us at any time if you have any questions, add WeChat: daixieit
DAT561: Midterm Project:
Smart Logistic Warehouse System in Amazon
Due Date: Friday, Nov 3, 2023
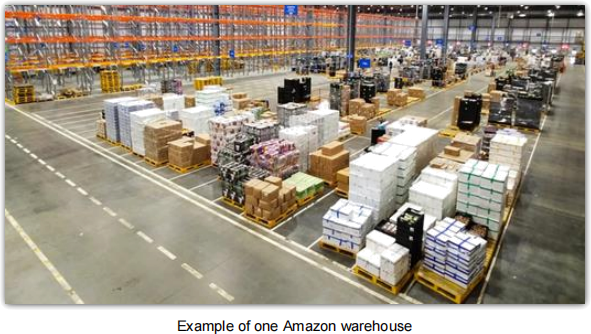
Amazon Inc. is an American multinational retail corporation that operates a chain of online hypermarkets and there are huge warehouses in the United States. Amazon warehouses are located throughout the country to ship out products and provide on-time delivery for customers.
Recently, Amazon is planning a 25-day countdown promotion for Christmas, and David King, a manager of Amazon Company, must make sure that the stored products in each warehouse are proper and sufficient. After consideration, David breaks this project into two parts:
1. Selecting products for each warehouse before the promotion starts
2. Simulating cross-warehouse-transshipment solution for possible product shortage problem for a random warehouse after the promotion starts
Working as a consulting team, you would provide your analysis to David, and all the data you need is available in the “Products.csv” file.
Here is some information about this dataset:
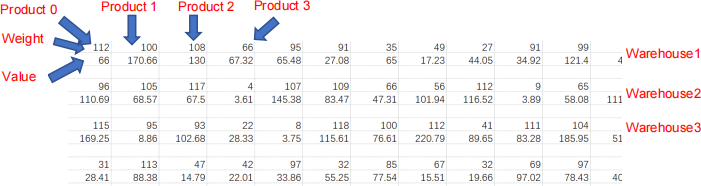
Each column contains the weight and value of each product, and there are a total of 50 available product options (Product No. 0 - Product No. 49) that can be selected for one warehouse.
Every two rows contain all product information in one warehouse, and there are 300 warehouses (Warehouse No. 0 - Warehouse No. 299) in total.
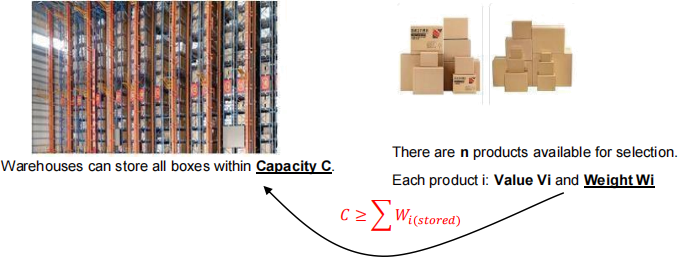
For each warehouse, there are four variables:
1. n - total number of products chosen to be stored in the warehouse
2. C - total weight capacity of the warehouse
3. Vi - the value of available product i
4. Wi - the weight of available product i
Specifically, for each warehouse, there is a weight capacity (C) of 850, which means that the total weight of n products that are selected to be stored in a warehouse should be less than or equal to 850. Each available product i has its own weight (Wi) and value (Vi). Besides, the product information for each warehouse is different.
Problem 1: The Estimated Value for Each Warehouse
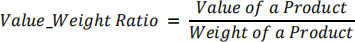
In this part, David wants to select products for each warehouse. He will choose products that have the top “Value Weight Ratios” as many as possible before reaching the capacity of each warehouse (850).
That is, he will first choose the product with the highest “Value Weight Ratio” to store in the warehouse, and then choose the product with the second-highest “Value Weight Ratio” to store, and so on until the warehouse reaches its capacity.
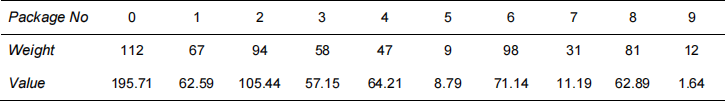
Here is a simplified example for one warehouse, assuming its capacity is 265 and 10 products could be selected. The weights and values of these products are listed below:
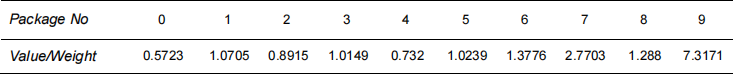
First of all, calculate the Value Weight Ratio for each product.
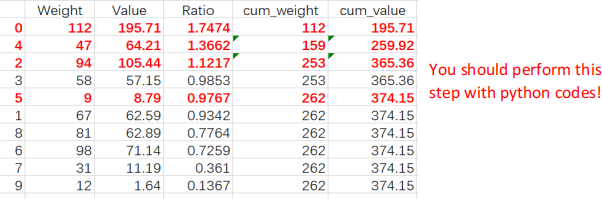
Secondly, sort the products based on the Value Weight Ratio in descending order.
Thirdly, start selecting products, and at the same time, look at the accumulated weight of products to make sure the accumulated weight does not exceed the warehouse weight capacity. With the capacity of this warehouse (265), after we select products 0, 4, and 2, the accumulated weight approaches 253, and only 12 are left for the next product. When we choose the fourth product, we select product 5 rather than product 3 because the weight of product 3 (58) is larger than the remaining capacity (12). Moreover, there is no more space to contain extra products in this warehouse. As a result, we finally have products 0, 2, 4, and 5 stored in this warehouse.
Lastly, calculate the corresponding estimated value of the warehouse, and in this case, it is 374.15.
Now you would try to help David with his product selection problem for those 300 warehouses (capacity of each is 850) with the dataset “Products.csv”. Calculating the estimated total value and the accumulated weight of each 300 warehouses will be helpful for the later decision of the cross-warehouse-transshipment solution.
Notes:
1. Please do not use other packages to read the CSV file.
2. You should perform all the steps above with python codes rather than a spreadsheet
3. Sometimes when the warehouse is nearly full, the next product with the next highest ratio cannot be put in the warehouse, but there are still chances that one or more remaining products can be put in the warehouse. Make sure you take every product into consideration; otherwise, you may have the risk of missing products.
4. You are NOT allowed to use the dynamic programming method in this problem; otherwise, you may get 0.
Problem 2: Top Alternative Selections
Thank you for your great job helping David with the warehouse storage arrangement! In this part, he would like to simulate the situation when a random warehouse is out-of-stock during the promotion period.
It is expected that awarehouse would run out of all the products during promotion, and in order to keep the promotion activities and make sure on-time delivery in one region, cross-region shipment from other warehouses (let’s call them “Helpers”) is necessary. More specifically, among the 300 warehouses, 10 are out-of-stock, then the rest 290 would all be Helpers.
Before seeking help from those Helpers, David needs to figure out which Helpers he could choose. For Helpers selection, David would choose those Helpers with the top 10 highest “Value_per_Weight” ratios. It’s acceptable to recommend more than 10 Helpers because two or more Helpers may have the same “Value_per_Weight” ratio.

1. Total_Value: total value of the stored products in one warehouse
2. Total_Weight: total weight of the stored products in one warehouse
3. Distance: the distance, generated by you, between the out-of-stock warehouse and the Helpers 4. Transportation_Cost: 0.012 per distance
Cross-warehouse-transshipment begins with the warehouse that is out-of-stock (total number of stored products is 0), and this warehouse would contact Helper to see if help is available. Once the Helper agrees to do the Cross-warehouse-transshipment, it will transport all products in its warehouse. In this case, David assumes that Helpers have not sold any products since the selection process in Part 1. In other words, the total number of stored products in each Helper remains the same as it was before the promotion started. Since the distances between this product-shortage warehouse and the Helpers are different, the transportation fee will be correspondingly different. By calculating the “Value_per_Weight,” David could find Helpers with the top 10 highest “Value_per_Weight” after considering transportation costs (The cost of a one-way trip from the Helper to the product-shortage warehouse).
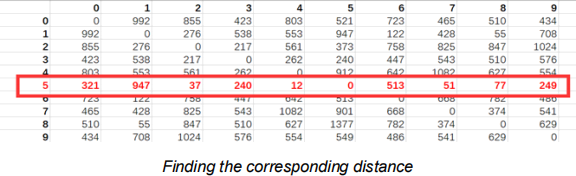
Step 1: Let's generate a distance matrix among the 300 warehouses first. Each of the
distances can be generated by using a normal distribution with a mean of 700 and a standard deviation of 300. (Please make sure that each generated distance is positive). Below is an example of a 10*10 distance matrix.
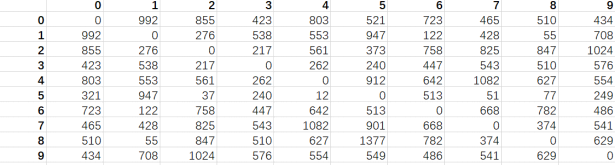
You must create your own distance matrix with a size of 300*300. Be careful, all the distances generated should be positive numbers and rounded to an integer using round (). After successfully generating the distance matrix, please write it to a new CSV file called “Distances.csv” .
Notes:
1. Please do not use any packages to write the CSV file.
2. For better understanding, we included the warehouse index in the screenshot, but the distance matrix you generated does not need to include the index.
Step 2: Now, you could calculate the “Value_per_Weight” and help David decide the Helpers with the top 10 highest “Value_per_Weight” .
First of all, David would randomly choose a warehouse (from Warehouse No.0 to Warehouse No.299) and assume it would face out-of-stock problems in this simulation.
Secondly, based on the warehouse he picks, you need to find the corresponding distance between this warehouse and each of the other Helpers from the distance matrix you generated in Step 1. Besides, you also need to find the corresponding total value and the total weight of all products stored in each Helper (you have calculated these numbers in Problem 1).
Thirdly, calculate the “Value_per_Weight” ratio for each Helper, sort the ratio in descending order, and choose the top helpers with the 10 highest “Value_per_Weight” ratios. Recall this formula:

1. Total_Value: total value of the stored products in one warehouse
2. Total_Weight: total weight of the stored products in one warehouse
3. Distance: the distance, generated by you, between the out-of-stock warehouse and the Helpers 4. Transportation_Cost: 0.012 per distance unit
Here is a simplified example, suppose now there are 10 warehouses in total , and David needs Helpers with the top 3 “Value_per_Weight” ratios. He assumes warehouse No. 5 is out-of-stock, and as a result, the total number of products in it becomes 0, while the rest of the warehouses (Helpers) remain with the same amount of product as you generated in Problem 1. The corresponding distance data is located in the 6th row of the distance matrix you have generated in Step 1 (the row starts with index 5 highlighted by the red rectangle below).
After calculating the “Value_per_Weight” ratio for each helper, you would sort those Helpers and return the top 3 “Value_per_Weight” and the corresponding index of the Helpers. (It is important you show the corresponding relationship between the “Value-per-Weight” and the index of the Helpers!)
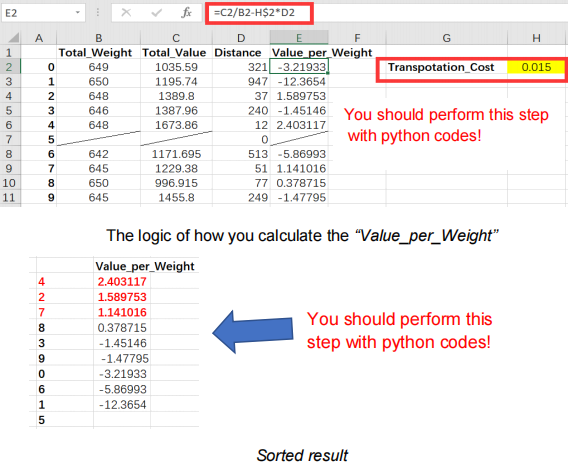
(You should use the code to show this logic instead of Excel, you do not need to generate a file here.)
Notes:
1. You are NOT allowed to use dynamic programming in this problem. Otherwise, your project may receive 0 points.
2. In this problem, there is a chance that the “Value_per_Weight ” of the two warehouses are the same. Return the top 10 Value_per_Weight, the distance to the out-of-stock warehouse, and if multiple warehouses have the same Value_per_Weight, determine those warehouses in the output.
Submission of the Project
Your final submission will contain two files:
1. The first would be the "Fall23_Mid_Amazon. ipynb" notebook. You need to provide the Python code as well as your answers. We strongly recommend you provide explanations for key steps in the code so that we can understand what you were trying to do when something goes wrong.
2. The second is the “Distances.csv” file.
Note: Please submit all files (Distances.csv, and Fall23_Mid_Amazon.ipynb files) as one zip file on Canvas. Please add the IDs of all teammates to the name of a zip file. For example, 14325_34672_12345.zip.
Grading: 100 points
10 points - towards how good your solution is.
We will check how you wrote the code and solved the problem, how efficient and optimized your code is. Specifically, your code will be graded based on the following factors:
1. Correctness: The code should produce the expected outputs and solve the problem correctly.
2. Readability: The code should be easy to read and understand with added comments.
3. Structure and organization: The code should be well-structured and organized. It should contain functions to modularize the code. Functions must have clear responsibilities and be appropriately organized.
4. Documentation and comments: The code should have clear and concise documentation to explain its purpose, inputs, outputs, and any important details.
5. Efficiency: The code should be efficient in terms of time and space complexity.
90 points:
The Estimated Value for Each Warehouse – 30 points
The 300*300 distance matrix generated – 30 points
Top 10 Warehouses Chosen for Help - 30 points
. Your code needs to pass the auto-grader for us to see whether it works.
. We will look at your logic and whether your code is working.
. We will look at whether you submitted all files correctly.
. We will look at how efficiently you solved the problems (functions, global scope, etc.).
2023-11-01