MAT 4179-5192 Assignment 4 Fall 2023
Hello, dear friend, you can consult us at any time if you have any questions, add WeChat: daixieit
Assignment 4
MAT 4179-5192
Fall 2023
To hand-in on
October 16, 2023 on Brightspace before midnight
Problem 1
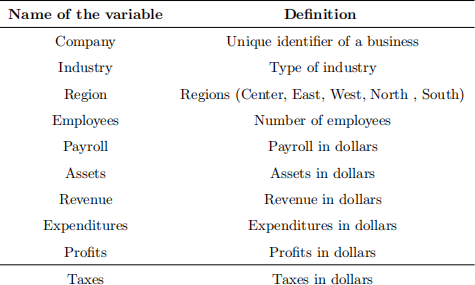
The file Company.txt contains the data from a simple random sample without replace- ment of size n = 4, 909 selected from a population of size N = 500, 000; see the table below for a definition of the variables. Use R for this problem.
(a) Estimate the total expenditures and construct a 95% confidence interval for total expenditures.
(b) Estimate the average payroll and construct a 95% confidence interval for average payroll.
(c) Estimate the proportion of businesses whose revenue is larger than 15, 000 dollars and construct a 95% confidence interval for this proportion.
Problem 2
Let S be a sample realized by the Bernoulli design with probability π . To estimate the population mean yU , we consider the following estimator:

where  denote the sample mean of they-values in the sample. Show that the relative bias of y* is given by
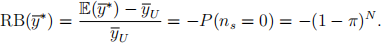
Note that the relative bias of y* is negligible if the population size N is large.
Hint: You may want to use the law of total expectations. Also, the result in Problem 2 of Assignment 2 will definitely be useful
Problem 3
![]() Let U be a finite population of size N. From U, we select a sample S according to a sampling design with first-order inclusion probabilities πi and second-order inclusion probabilities πij . To estimate the population mean of a y-variable
Let U be a finite population of size N. From U, we select a sample S according to a sampling design with first-order inclusion probabilities πi and second-order inclusion probabilities πij . To estimate the population mean of a y-variable  we propose to use the sample mean y s.
![]() (a) Show that the bias of ys is given by
(a) Show that the bias of ys is given by
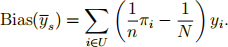
When is the bias equal to 0? This exercise shows that the sample mean is not unbiased for the population mean, in general, except for some particular sampling designs.
![]() (b) Determine the variance of ys under this sampling design.
(b) Determine the variance of ys under this sampling design.
Problem 4
In a finite population of N = 4, 000 individuals, we are interested in estimating two proportions:
(1) P1 = proportion of individuals in the population owning a dishwasher;
(2) P2 = proportion of individuals in the population owning a laptop computer.
We have some a priori information about P1 and P2. We know that 45% ≤ P1 ≤ 65% and 5% ≤ P2 ≤ 10%. To estimate both P1 and P2 based on a simple random sample without replacement of size n. What value of n will ensure that both the sample proportion P(~)1 will fall within 2% of the true value that the sample proportion P2(~) to fall within 1% of the true value with probability 95%?
Problem 5 (For graduate students only)
![]() Consider a population U of size N. From U we select a sample S, of size n, according to simple random sampling without replacement. After the sample has been selected, it was realized that y1 would be unusually low and yN would be unusually high. For this situation, S¨arndal (1972) proposed the following estimator of the population mean
Consider a population U of size N. From U we select a sample S, of size n, according to simple random sampling without replacement. After the sample has been selected, it was realized that y1 would be unusually low and yN would be unusually high. For this situation, S¨arndal (1972) proposed the following estimator of the population mean 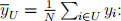
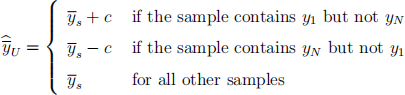
![]() where
where  and c is a constant.
(a) Argue that  can be written as
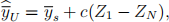
where Z1 and ZN denotes the usual sample selection indicators for unit 1 and unit N, respectively.
(b) Using (a), show that is design-unbiased for .

(c) Show that the design variance of is given by

(d) Show that
2023-10-30