PSYC7301 (2023-24 Semester 1) Assignment 1
Hello, dear friend, you can consult us at any time if you have any questions, add WeChat: daixieit
PSYC7301 (2023-24 Semester 1)
Assignment 1
Due Date: 27 Oct, 2023, 3:30pm
- Submit an electronic copy of your answers to Moodle.
- For question 2c, you will need to scan your sketch and attach it to your answer. You can also use a computer
software to draw the sketch. If neither of the above options is feasible, please submit a hard copy to Wendy’s
mailbox in the general office on the 6th floor of Jockey Club Tower by the same deadline. For other difficulties, please contact Wendy.
- Late assignments will be subject to a late penalty of 20% deduction per calendar day (including weekends and public holidays). Late submissions due to medical reasons MUST be requested BEFORE the assignment is due.
- Finish the assignment on your own. You should be able to finish it within 2 hours.
- Round numerical answers to 2 decimal places (use more decimal places for calculation).
Question 1
Kent studied the relationship between children’s head circumference and intelligence. Download the data A1Q1.csv and complete the following tasks.
a) Identify the two variables and their data levels in this study. (1 mark)
b) Using Jamovi, create a histogram for each of the two variables. Report the mean and standard deviation of each variable. (1mark)
c) Describe and compare the shapes of the two distributions. (1mark)
d) Calculate the Z-scores of the two variables for the subject #8. Show your calculation clearly. (2 marks)
Question 2

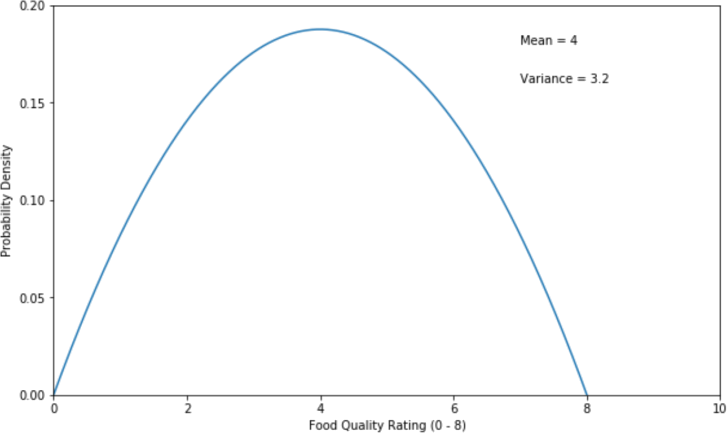
HKU students have divided opinions regarding the food quality on campus. The above figure illustrates the population
distribution of students’ ratings on a continuous scale running from 0 (poor) to 8 (excellent). It is a symmetrical distribution with a mean of 4 and a variance of 3.2. The total area underneath the distribution is 1 (or 100%).
a) Compare the above distribution with a normal distribution in terms of their shapes and ranges of values. (1 mark)
b) In the distribution, a score of 2 would be at a percentile of 15.625% (i.e., 15.626% of the population would give a score equal to or lower than 2). Deduce the percentile of a score of 6 (i.e., the percentage of the population that would give a score equal to or lower than 6). (1 mark)
A new canteen just opened and the owner, Tom, collected 30 ratings from students who tried it on the first day. The average score was 3.3. With a difference from the mean by less than 1 point, Tom conceived that the new canteen was performing as good as the old one.
c) Sketch the sampling distribution that Tom should compare his sample mean with. The sketch should show clearly the shape and scores at mean, 士1 standard error (SE), 士2 SE, and 士3 SE. (1.5 marks)
d) Was the first day’s performance statistically different from the past performance? Conduct a statistical test with 5% as the decision cut-off. Explain the logic with reference to the sampling distribution drawn in part c. (3.5 marks)
e) The p-value of the z-test is 3.24%. Explain what it means. (1 mark)
2023-10-27