ECON 5011, Macroeconomics (MA), Fall 2023 Assignment #1
Hello, dear friend, you can consult us at any time if you have any questions, add WeChat: daixieit
ECON 5011, Macroeconomics (MA), Fall 2023
Assignment #1
Due: Monday, October 26, 2023 (before class)
1 Growth and Income Inequality
Thomas Piketty’s book (Piketty and Goldhammer (2014)), Capital in the Twenty-First Century, has attracted widespread attention of the academics and the popular media. The book makes two main contributions to the discussion of income inequality and growth. First, Piketty and his co- authors (such as Emanuel Saez, Anthony Atkinson, and Gabriel Zucman) collected historical data on income and wealth of very rich households; i.e., those at the top 5%, top 1%, top 0.1% of the income distribution in major developed countries dating back to 19th century. They document that the share of income that goes to top earners has increased significantly since the early 1980s and today’s wealth accumulation (as a ratio of national income) has reached its highest level since World War I.
Figure 1: The transformation of the top 1% in the United States
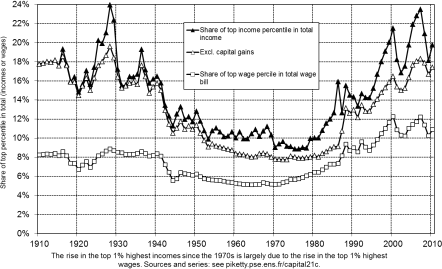
For example, Figure 1 plots the share of total income claimed by top 1% since early 20th cen- tury. A striking fact stands out from this chart is that both labor and capital income inequality has followed a U-shaped pattern in the US during the last century. Prior to the 1980s, income inequal- ity greatly diminished: the top 1% share of total income decreased to around 9% from around 20% in late 1920s. Yet, after the 1980s income inequality dramatically rose in the US. Today the income share of the top 1% of the population has reached the very high levels of America’s Gilded Age.
Furthermore, he also documented that today’s wealth accumulation (as a ratio of national in- come) has reached its highest level since World War I (WWI). Figure 2 plots the wealth to income ratios in major developed economies since 1970s (source: Piketty and Zucman (2014)). All major economies have seen their wealth increase at a faster pace than their national income.
Figure 2: Figure 1: Private wealth / national income ratios 1970-2010
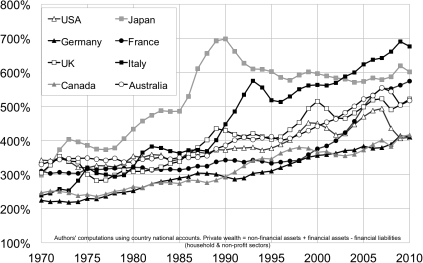
Source: Piketty and Zucman (2014)
The second contribution of the book is a theoretical prediction: Piketty predicts that there will be a further increase in the wealth to income ratio in the future as income growth slows down due to slower productivity and population growth. Furthermore, he also argues that the marginal product of capital (rate of return on capital) will diminish only slowly that a rise in the ratio of wealth (capital) to income will result in an increase in capital’s share of income.1 Since capital income is highly concentrated, this will lead to an increase in income inequality in the economy.
In the first part of this assignment you will analyze Piketty’s predictions about the evolution of the wealth to income ratio, capital’s share of income, and income inequality theoretically through the lenses of Solow and neo-classical growth models. For this purpose please discuss the following questions:
1. Show that the share of capital income, a, equals to the rate of return on capital,r times the wealth to income ratio, β (β =Y/K , where K is capital (wealth) stock in the economy and Y is the output.): a = rβ .2 (1 point)
2. Piketty argues that in the long run capital-net income (income net of depreciation) ratio
converges to the ratio of net saving rate˜(s)(savings net of depreciation) to technology’s growth rate, g; i.e., β(˜) = s/g .3 For example, if a country saves 10% of its output net of depreciation each year, and the technology grows at at a rate of 2%, then wealth to income ratio in this country would be 500%.
(a) Suppose that instead of gross saving rate s, net saving rate, ˜(s) is constant in the Solow growth model (for now let’s assume no population growth, n = 0). Furthermore, we need to assume that marginal product of capital is bounded below by δ ; i.e., FK(K;AL) - δK ! 0 as K ! 0.
i. Define the following “net” variables (variables net of depreciation) in terms of
gross variables: net saving rate (˜(s)), net output (Y(˜)), net investment (I(˜)). (1 point)
ii. Show that there is a balanced growth path in which capital K and net output Y(˜) are
growing at the rate of 1 + g. (2 points)
iii. Show that β(˜) = ![]()
iv. Derive the gross saving rate (s = ![]() in terms of the model parameters. (3 points)
in terms of the model parameters. (3 points)
v. Piketty argues that as the economy’s growth rate declines to zero (g ! 0), capital- net income ratio may increase indefinitely (β(˜) ! ¥). What happens to the gross
saving rate, s in this case? Discuss Piketty’s claim in light of your answer to the above question. (2 points)
vi. Does this model satisfy basic growth (Kaldor) facts? Explain. (2 points)
vii. How would your answers to above questions change if the population grows at the rate of 1 + n? (2 points)
(b) Now suppose that gross saving rate s is constant as in the version of Solow model we saw in the class.
i. Derive β in the steady state in terms of the model parameters. (2 points)
ii. Derive the net saving rate in the steady state in terms of the model parameters. (2 points)
iii. Deriveβ(˜) capital to net income ratio. (2 points)
iv. What happens to the net saving rate,˜(s) and wealth to income ratio β , and wealth to net income ratio β as g ! 0? (2 points)
v. How would your answers to above questions change if the population grows at the rate of 1 + n? (2 points)
(c) In the neo-classical growth model on the balanced growth path:
i. Derive the steady state output and capital in terms of model parameters. (2 points)
ii. Derive saving rate s and net saving rate˜(s) in terms of model parameters. (3 points)
iii. Derive wealth to income ratio, β and wealth to net income ratioβ(˜). (3 points)
iv. What happens to, s,˜(s), β , and β(˜) as g ! 0? (2 points)
(d) Discuss Piketty’s prediction about the evolution of the wealth to income ratio through the lenses of Solow and neo-classical growth models. (2 points)
3. Piketty argues that as an empirical observation through much of the history the average an-
nual net return on capital, ˜(r) (˜(r) = r - δ ), has been higher than the economy’s growth rate,
g, and as a result capital and capital income tend to increase at a faster pace (˜(r)) than the
national income (g). Namely, if the net return on capital significantly exceeds the growth rate of the economy, then capital owners can accumulate capital faster than output and labor income grow.4 He sees this as a fundamental force of divergence for inequality between cap- ital owners (the very rich) and workers. You’ll analyze this argument theoretically through the lenses of Solow and neo-classical growth models. For this purpose please discuss the following questions:
(a) In the Solow growth model can˜(r) < gbe true? Discuss what would˜(r) < g or˜(r) > g imply
in terms of efficiency? (1 point)
(b) In the neo-classical growth model can˜(r) < gbe true? Discuss what would˜(r) < g or˜(r) > g
imply in terms of efficiency? (1 point)
(c) In the OLG model can˜(r) < gbe true? Discuss what would˜(r) < g or˜(r) > g imply in terms
of efficiency? (1 point)
(d) Piketty assumes that as the economy accumulates more capital, the net return on capital
(marginal product of capital net of depreciation),˜(r), will diminish only very slowly that
a rise in the ratio of capital to income will result in an increase in share of capital income.
i. Suppose that δ = 0 in the Solow model (so net and gross variables are are equal):
A. Derive the net return on capital? (1 point)
B. Derive the share of capital’s net income out of net output? What happen’s to
share of capital income if the wealth to income ratio (β(˜)) increases? (1 point)
C. How would your answers to above questions change if δ > 0? (3 points)
D. How would your answers to above questions change for the neo-classical growth model? (2 points)
2 Cross-country Income Differences
For this part of the assignment you need to use data from the Penn World Table, version 10.0.5
1. Why is this data appropriate for making cross-country comparisons of output and its com- ponents? (1 point)
2. Download real GDP per capita and real GDP per worker (constant prices, chain series) in 2010 for all countries in the data set. Order countries by their real GDP per capita. Calculate average real GDP per capita and average real GDP per worker for each of the deciles of the world income distribution. What is the disparity in (average) real GDP per capita and (average) real GDP per worker between the richest 10% of countries and each other decile of the income distribution. (2 points)
3. Obtain real GDP per capita in 1960 for all countries available. Rank them according to real GDP per capita. Calculate the income disparity for each decile compared to the richest 10% of countries. How does the income disparity between the richest and poorest 10% of countries in 1960 compare to that in 2010? (1 point)
4. Focus on China (or any other choice of your country) and the United States.
(a) Plot each country’s real GDP per capita and GDP per worker from 1955 to 2019. Cal- culate each country’s average annual growth rate over this period. (1 points)
(b) In 2019 what accounts for the output per worker disparity between the countries? For this purpose, first, derive the output per worker in the Solow model. Then decompose output per worker differences between the US and China into productivity, labor and capital components. Assume that a = 0:3. (Hint: use other information from the Penn World Table). (2 points)
References
PIKETTY, T. and GOLDHAMMER, A. (2014). Capital in the twenty-first century. Belknap Press.
— and ZUCMAN, G. (2014). Capital is back: Wealth-income ratios in rich countries, 1700-2010. The Quarterly Journal of Economics.
2023-10-27