BME 511 Sample Exam #2A Fall 2023
Hello, dear friend, you can consult us at any time if you have any questions, add WeChat: daixieit
BME 511
Sample Exam #2A
Fall 2023
1. Figure 1A shows a simple negative feedback system with variable gain K (>0) in the feedback element.
a. (10 pt) Derive the closed-loop transfer function of this system.
b. Assuming that K = 1, break the transfer function into the product of 2 simpler transfer functions as displayed below:
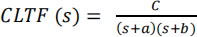
where C, a and b are constants for you to determine. For each component transfer function, determine the expressions (showing all your steps) for:
i. (5 pt) Logarithmic gains (in dB)
ii. (5 pt) Low-frequency asymptotes
iii. (5 pt) High-frequency asymptotes
iv. (5 pt) Breakpoint frequencies
c. (10 pt) Using Figure 1B, sketch the overall Bode plot of your system. Briefly explain (or mathematically show) how you determined your low-frequency asymptote,
breakpoint(s), and slope(s) of high-asymptote curves. NOTE: the slopes don’t have to be drawn perfectly, as long as you denote the values of the different slopes.
Figure 1A.
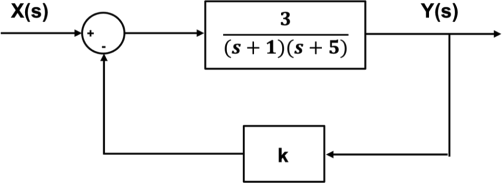
Figure 1B.

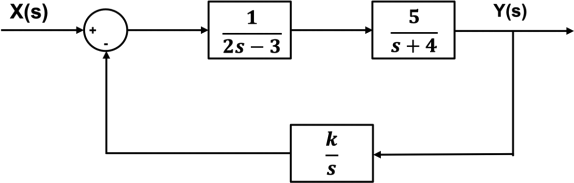
2. Figure 2A and 2B show block diagrams of the same system but with proportional feedback and integral feedback, respectively.
a. (15 pt) Using the root locus method, determine whether the closed-loop system in
Figure 2A will be stable or unstable overall all possible positive values of K (>0).
NOTE: please show your steps in explaining the k values and/or range of values you have selected.
b. ( 15 pt) Using the Routh-Hurwitz stability test, determine the range of positive values of K (>0) over which the model in Figure 2B will remain stable. Show all your
mathematical steps.
Figure 2A.

Figure 2B.
3. The curves displayed in Figure 3 represent the Nyquist plots of the loop transfer function of the ventilatory chemoreflex system under a variety of conditions (A1, A2, M1, M2, H1, H2). Note that the numbers placed next to the points (closed circles) highlighted for each Nyquist plot represent the cycle duration (NOT frequency in Hz), in units of seconds, corresponding to the frequency response at that frequency. The circle displayed in dashed line represents all points on the complex plane with loop gain magnitude equal to unity – the point marked as “X” designates the point (- 1 + j0). Also, take phase (。) to be positive in the anticlockwise direction.
a. (5 pt) Under which conditions (A1, A2, M1, M2, H1, H2) is this system stable? Briefly explain how you arrived at your answer.
b. (5 pt) For the systems that are not stable, estimate the cycle durations at which you would expect the system to exhibit oscillations with growing amplitude. Briefly explain how you arrived at your answer.
c. ( 10 pt) Estimate the gain margin and phase margin for the system under condition M2. Provide your answer in units of dB (gain margin) and degrees (phase margin). Briefly explain how you arrived at your answers.
d. ( 10 pt) Estimate the gain crossover frequency and phase crossover frequency for the system under condition M2. Provide your answers in units of rad/s. Briefly explain
how you arrived at your answers.
Figure 3.

2023-10-25