IE5600 – Applied Programming for Industrial Systems
Hello, dear friend, you can consult us at any time if you have any questions, add WeChat: daixieit
IE5600 – Applied Programming for Industrial Systems
AY 2023/24 Semester 1
Individual Assignment 1 - PyPivot
Objectives
At the completion of the individual assignment, you should:
1. Develop a better understanding of how to apply the computational problem solving process to a moderately complex problem.
2. Implement imperative and structured programming paradigms in Python.
3. Apply appropriate control flow statements to implement algorithm.
4. Apply appropriate multi-dimensional data structures to implement algorithm.
General Requirements
You are required to develop a Python program known as PyPivot to manage data in a two- dimensional dataset consisting of column header representing attribute name and row header representing record identifier. The program should then allow user to visualise the data in a pivot table. A pivot table is a table of grouped values that aggregates the individual data items in the original dataset within one or more discrete categories. Typical aggregate functions include count, sum, average, minimum and maximum.
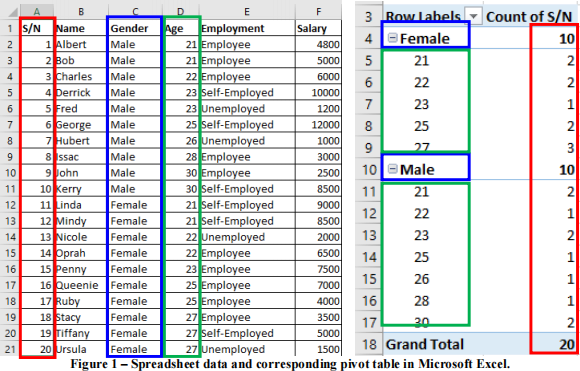
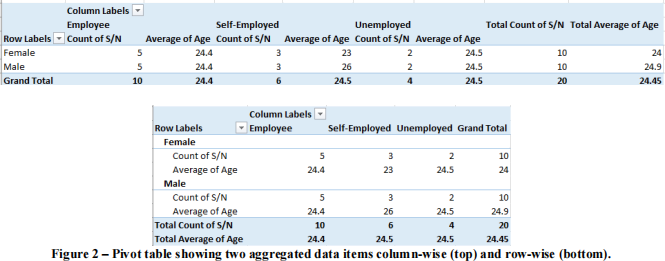
Figure 1 shows a typical pivot table in Microsoft Excel. As shown in Figure 1, categorical attributes may be placed in a pivot table as columns, rows or a mixture of both. If there are more than one aggregated data items, they can be placed in the pivot table column-wise or row-wise as shown in Figure 2.
Use Cases
Implement the following use cases for PyPivot without the use of any Python modules. In other words, your program should NOT contain any import statement unless you are importing your own user-defined module(s).
|
S/N |
Use Case |
Use Case Description/Business Rules |
|
1 |
New Dataset (0 mark) |
. Initialise PyPivot with a new empty dataset containing zero column and zero row. . If there is an existing dataset (at least one column and/or one row, prompt user to confirm the reinitialisation. |
|
2 |
Load Test Dataset (0 mark) |
. Auto load the dataset shown in Figure 1. . This dataset can be downloaded from Canvas. |
|
3 |
Add Column (1 mark) |
. Add a new column to the dataset with an alphanumeric attribute name. . If the dataset contains at least one row, prompt user to input a default value for the new column. . The program should use a one-based index number as the default row identifier. It is not necessary to designate a column as the row identifier. Sample Input: . Add Name . Add Gender . Add Age . Add Employment . Add Salary |
|
4 |
Delete Column (1 mark) |
. Delete an existing column in the dataset using its attribute name. . If the dataset contains at least one row, all existing data for the affected column should be deleted. Sample Input: . Delete Gender |
|
5 |
Add Row (1 mark) |
. Add a new row to the dataset. . There should be at least one column in the dataset. Otherwise, print out an error message. . Prompt user to input data value for each existing column/attribute. . It is not necessary to perform input data validation. Sample Input: . Name – Albert . Gender – Male . Age – 21 . Employment – Employee . Salary – 4800 |
|
6 |
Delete Row (1 mark) |
. Delete an existing row in the dataset using its row identifier, i.e., the one-based index number. . If the row does not exist, print out an error message. Sample Input: . Delete 1 |
|
7 |
View Pivot Table Fields (1 mark) |
. View the list of current pivot table field(s) added by the user. . By default, a new dataset does not have any pivot table field. . There are three types of pivot table field that can be added by user: o Columns – Categorical attributes designated as the column header. o Rows – Categorical attributes designated as the row header. o Values – Data attributes that are aggregated from the original data values. The following aggregation functions should be supported: . Count . Sum . Average . Minimum . Maximum Sample Output: Columns: . Employment Rows: . Gender Values: . Salary – Average . To indicate column-wise or row-wise display if there are more than one value fields. See Figure A.1 in Appendix. |
|
8 |
Add Pivot Table Field (1 mark) |
. Add a pivot table field by prompting user to input attribute name and field type. For value field, prompt user to select the required aggregation function. . If there are more than one value fields, prompt user to select column-wise or row-wise display. . If the attribute has already been added as a pivot table field, print out an error message. Sample Input: . Gender . Row |
|
9 |
Delete Pivot Table Field (1 mark) |
. Delete an existing pivot table field by prompting user to input attribute name. . If the attribute has not been added as a pivot table field, print out an error message. |
2023-10-24