FIT5137 S2 2023 Assignment 4: PTV Assignment Scenario
Hello, dear friend, you can consult us at any time if you have any questions, add WeChat: daixieit
FIT5137 S2 2023 Assignment 4: PTV Assignment Scenario (Weight = 30%)
DO NOT SUBMIT THIS DOCUMENT
Due date: Wednesday, 25 October 2023, 11:55pm
A. General Information and Submission
● This is a group assignment. One group consists of TWO or THREE students from the same lab you have enrolled in. You need to register your group composition through the Assignment 4:PTV Group Self Selection Form[Assessment page, Moodle site] as soon as possible.
● Submission method: Submission is online through Moodle.
● Penalty for late submission: 10% deduction for each day.
● Assignment coversheet: You will need to sign the assignment coversheet.
● Contribution form: The contribution form needs to be completed by all members and signed (e-signature is acceptable) as an agreement between members.
● Assignment FAQ: There is a Assignment 4 FAQ page set up on the EdStem forum.
B.Assignment Background

You have been hired as a data analyst at Public Transport Victoria (PTV), the Victorian Government authority responsible for public transport in the state. Some of your duties are data extraction, integration and analysis to provide good understanding regarding the public transportation condition in Victoria to the stakeholders.
After the COVID-19 restrictions were lifted, most companies are switching the workstyle from work-from-home to face-to-face. Therefore, transportation infrastructure and network is one of the most important aspects. While some of the people prefer to drive to work, some of other people prefer to use public transportation network as their main transportation mode. PTV as the sole provider for the public transportation network reduced their services during the lockdown period. Now, PTV has restored the services to cover as many areas as possible in the whole regions. However, some questions remained mysteries. How good is the current PTV coverage? Is there any uncovered spots? Which area has the best public transportation options?
Therefore, as a data analyst, your task is to evaluate the data and provide the spatial data analysis to the stakeholders of PTV. The data should be presented in an area level, such as municipality, suburbs or postcode. For example, you may present “The number of bus services in Bundoora” or "The number of Trains or Trams network in Bundoora”.Page number 2
Data
There are two datasets that you have to obtain in this assignment, which are the PTV/GTFS dataset and Australian Boundary data.
The General Transit Feed Specification (GTFS) is a data specification that allows public transit agencies to publish their transit data in a format that can be consumed by a wide variety of software applications. Today, the GTFS data format is used by thousands of public transport providers.
GTFS is split into a schedule component that contains schedule, fare, and geographic transit information and a real-time component that contains arrival predictions, vehicle positions and service advisories. A GTFS feed is composed of a series of text files collected in a ZIP file. Each file models a particular aspect of transit information: stops, routes, trips, and other schedule data.
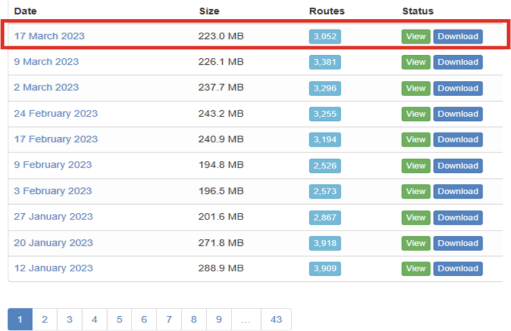
For more detailed information about GTFS, you can refer to the official documentation provided by Google at https://developers.google.com/transit/gtfs. Additionally, You can read further explanation about the PTV-GTFS data from https://transitfeeds.com/p/ptv/497. For this assignment, we will be using the 17th March 2023 version of the dataset.Page number 3

The GTFS data structure is shown below:
The Australian digital boundary is defined by the Australian Bureau of Statistics using the Australian Statistical Geography Standard (ASGS). The ASGS is a classification of Australia into a hierarchy of statistical areas. It is a social geography, developed to reflect the location of people and communities. It is used for the publication and analysis of official statistics and other data. The ASGS is updated every 5 years to account for growth and change in Australia’s population, economy and infrastructure. For the 2021 release, the ASGS will be re-named to the Australian Statistical Geography Standard (ASGS) Edition 3.
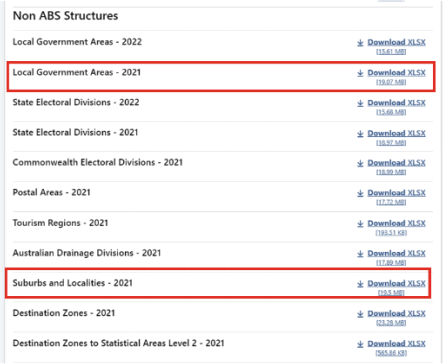
The ASGS is split into two parts, the ABS and Non ABS Structures. The ABS Structures are geographies that the ABS designs specifically for the release and analysis of statistics. This means that the statistical areas are designed to meet the requirements of statistical collections as well as geographic concepts relevant to those statistics. This helps to ensure the confidentiality, accuracy and relevance of ABS data.The Non ABS Structures generally represent administrative regions which are not defined or maintained by the ABS, but for which the ABS is committed to directly providing a range of statistics.
The Main Structure is developed by the ABS and is used to release and analyse a broad range of social, demographic and economic statistics. It is a nested hierarchy of geographies, and each level directly aggregates to the next level. Mesh Blocks (MBs) are the smallest geographic areas defined by the ABS and form the building blocks for the larger regions of the ASGS. Most Mesh Blocks contain 30 to 60 dwellings.
Below is the simplified ABS and Non ABS Structure. You can read further explanation about the structure here https://www.abs.gov.au/statistics/standards/australian-statistical-geography-standard-asgs-edition-3/jul2021-jun2026#overviewPage number 4

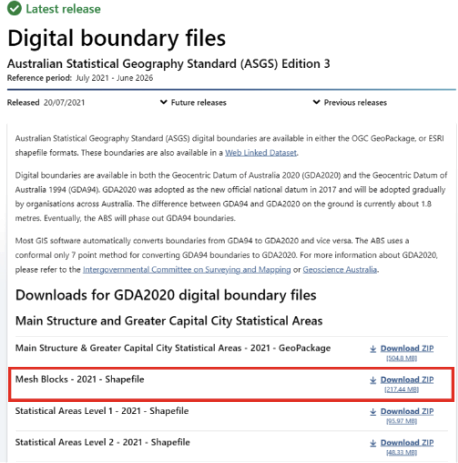
The Digital boundary files that you have to get is the Mesh Blocks dataset. The Mesh Blocks dataset is available as Shape file. You can read further explanation about the Mesh Blocks dataset here
https://www.abs.gov.au/statistics/standards/australian-statistical-geography-standard-asgs-edition-3/jul2021-jun2026/access-and-downloads/digital-boundary-filesPage number 5
Allocation files are non-spatial representations of how each geography is aggregated from their building block geography. You can also read further explanation about the Allocation files dataset here
https://www.abs.gov.au/statistics/standards/australian-statistical-geography-standard-asgs-edition-3/jul2021-jun2026/access-and-downloads/allocation-files
Assignment Task list
Your assignment consists of several parts. Always read the instruction one by one. Do not move to the step without completing the previous step:
● Task 1: Data Restoration - Restore the data to the database. Monitor the success indicator to ensure successful restoration of the data.
● Task 2: Data Preprocessing - Perform necessary structure maintenance and create result tables for further processing.
● Task 3: Data Analytics - Develop SQL queries to analyze the data and evaluate performance.
● Task 4: Data Visualization - Create visualizations to present the results of the data analytics.
For simplicity, all the data required for this assignment is readily available in the PostGIS Docker container. You can access these datasets within the container by navigating to the /data/adata folder.If you don’t know how to do it, refer to the labs 10 activities.Page number 6

Verify your data before the restoration process.

As a data analyst, it is your responsibility to understand and explore these publicly available data.
Important note:
The question and answer box is available in the FIT5137_A4_PTV_Answer sheet[Assessment page, Moodle site]. Please carefully follow the provided instructions to answer each question.
● When submitting your assignment, ensure that the FIT5137_A4_PTV_Answer sheet is in PDF format.
● There is no need to submit this assignment scenario file.Page number 7
C. Submission Checklist
1. One combined .pdf file containing all tasks mentioned above:
□ Cover page
□ A signed coversheet
□ A Group Contract & contribution declaration form:
Note:
Each student must state the parts of the assignment that they completed. An example is as follows:
Note:
● If you group shared workload equally, the contribution percentage will be 50% or 33%. Otherise, the contribution percentage must end in 0, e.g, 80%, 20% [85% is not acceptable]
● The example is based on a Group of 2 scenario, and the Contribution Declaration template can also be found on the Assignment 4 FAQ page, Ed forum.
Example:
Percentage of contribution:
1. Name: Adam, ID: 210008, Contribution: 60%
2. Name: Ben, ID: 230933, Contribution: 40%
List of parts that each student completed:
1. Adam: list the parts that Adam did
2. Ben: list the parts that Ben did
□ Assingment 4 Answer Sheet
Note:
Ensure that each answer box on the Assingment 4 Answer Sheet contains a well-organised and clear answer.
● The SQL script or commend should be properly structured and,
● The screenshot must be coherent, concise and aligned with the query.
2. Consolidate all SQL scripts from tasks 1 to 4 into a single .sql file for submission. Verify the provided file's executability to guarantee its functionality.Page number 8
2023-10-20