STAT 221 – Fall 2023 Assignment 2
Hello, dear friend, you can consult us at any time if you have any questions, add WeChat: daixieit
STAT 221 – Fall 2023
Assignment 2, due at 11:59pm on Friday, October 20, 2023
Notes for submission:
• Upload your assignment directly to Crowdmark via the link you received by email. It is your responsibility to make sure your solution to each question is submitted in the correct section, that the pages are rotated correctly, and that everything is legible.
• All calculations/graphs are to be done by hand unless told otherwise.
• Show all your work for full credit.
Question 1. (2+1+3+4 points)
(a) We are tossing a coin, with the probability for “head” being equal to 0.3. What is the probability to get at least 2 heads when tossing this coin 10 times?
(b) Let the mean burning time of a light bulb of a certain type be 100 operating hours; we assume this burning time be exponentially distributed. What is the probability that the bulb will function at least 80 hours before it blows?
(c) Let X ∼ G(80, 14.81). What is the probability P(X ≥ 100)?
(d) Let us assume that 70% of a given population have dark hair, 20% blond hair and the remaining 10% red hair. What is the probability that in a sample with 20 participants taken from this population 15 participants have dark hair, 4 blond hair and only one participant has red hair?
Question 2. (1+2+2 points)
We consider the following final grade data for 90 STAT 221 students:
99, 96, 95, 94, 94, 93, 93, 92, 92, 92, 88, 87, 87, 86, 86, 86, 86, 85, 85, 85, 82, 81, 81, 80, 80, 79, 79, 79, 78, 78, 73, 73, 72, 71, 71, 70, 70, 70, 69, 69, 61, 60, 59, 57, 54, 54, 53, 48, 47, 42, 91, 91, 91, 90, 85, 85, 84, 84, 77, 77, 77, 76, 68, 68, 68, 67, 90, 90, 89, 89, 88, 88, 84, 83, 83, 82, 82, 82, 76, 75, 75, 75, 74, 74, 66, 66, 65, 64, 64, 63
(a) Use R to construct a relative frequency histogram and comment on the skewness of the given sample data. Include your R code and the corresponding output as a part of your answer.
(b) Use R to construct a qqplot for the sample data. Include your R code and the corresponding output as a part of your answer.
(c) Using your results in (a) and (b), assess whether it is reasonable to assume a Gaussian model for these data. Explain your answer for full credit.
Question 3. (2+1+2 points)
A Poisson model has been proposed to model the number of arrivals per minute at a bank located in a large city. Suppose that the actual arrivals per minute were observed in 300 one-minute intervals over the course of a week. The results are presented in the table below.
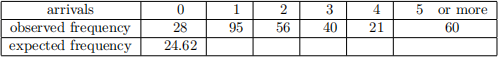
(a) Let the mle of θ based on the above data be θ ˆ = 2.5. Calculate the expected frequencies and complete the table above. Show all your work for full credit.
(b) How well does the chosen Poisson model fit the data? Justify your answer.
(c) What is the maximum likelihood estimate of the probability that during a 2 minute interval there will be no arrivals at the bank?
Question 4. (1+1+1+1+1+2+3 points)
A study investigates the average tire wear over a two year period on buses in Ontario. The study focussed on a new fleet of 100 buses in Waterloo, Ontario over the period from January 2021 to December 2022.
The amount of tire wear for a given tire is estimated by measuring the tread depth of the tire with a tire gauge. Assume that each bus had 4 tires and the tires were not replaced over the two year period. At the end of the two year period, one tire was randomly selected from each of the 100 buses, and the amount of tire wear was measured.
Let Yi denote the random variable representing the tire wear of the i th tire in the random sample, with i = 1, 2, . . . , 100 and Yi ∼ G(µ, σ).
(a) What is a unit in this study?
(b) Define a suitable target population for this study.
(c) Define a suitable study population for this study.
(d) What is the response variate in this study?
(e) Is the response variate in (d) discrete or continuous? Provide a short explanation for full credit.
(f) What is the attribute of interest in this study?
(g) Would you a substantial study error in this study? Why or why not? Explain your answer for full credit.
Question 5. (3+2 points)
Suppose that the proportion of impurity, Y , in an iron ore specimen can be modeled with the following probability density function
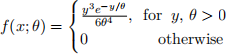
(a) Assuming that a random sample of n independent impurity observations is drawn from a population with the above density function, determine the log likelihood function, l(θ). Show all your work for full credit.
(b) Now suppose that a random sample of 10 independent impurity measurements was drawn. The results are as follows:
0.1348, 0.0020, 0.0216, 0.4593, 0.0177, 0.0381, 0.3911, 0.6264, 0.0286, 0.0002
For the provided data, find the maximum likelihood estimate for θ.
2023-10-19