FIT1043 Assignment 2 Specifications
Hello, dear friend, you can consult us at any time if you have any questions, add WeChat: daixieit
FIT1043 Assignment 2 Specifications
Objective
Assignment 1 covered the process of conducting descriptive analytics, whereas the objective of this assignment (Assignment 2) is to conduct predictive analytics, through machine learning using Python in the Jupyter Notebook environment. This assignment will test your ability to:
● Read and describe the data using basic statistics
● Split the dataset into training and testing
● Conduct binary classification using Random Forest and Decision Tree,
● Implement linear regression for prediction,
● Communicate the output of your analysis,
● Experience independent model evaluation through reporting the metrics
Data
There are two datasets (only one data for each question) for this assignment as follows:
Dataset for the first question: The data is provided in a single comma separated (CSV) file. The dataset contains various information for borrowers who have requested loan from an investor (lender). Hopefully, as an investor you would want to invest in people who showed a profile of having a high probability of paying you back. You are supposed to create a model to classify and predict whether or not the borrower paid back their loan in full. The columns are:
● credit.policy: 1 if the customer meets the credit underwriting criteria of investor, and 0 otherwise.
● int.rate: The interest rate of the loan, as a proportion (a rate of 11% would be stored as 0.11). Borrowers judged by investors to be more risky are assigned higher interest rates.
● installment: The monthly installments owed by the borrower if the loan is funded.
● log.annual.inc: The natural log of the self-reported annual income of the borrower.
● dti: The debt-to-income ratio of the borrower (amount of debt divided by annual income).
● fico: The credit score of the borrower.
● days.with.cr.line: The number of days the borrower has had a credit line.
● revol.bal: The borrower's revolving balance (amount unpaid at the end of the credit card billing cycle).
● revol.util: The borrower's revolving line utilization rate (the amount of the credit line used relative to total credit available).
● inq.last.6mths: The borrower's number of inquiries by creditors in the last 6 months.
● delinq.2yrs: The number of times the borrower had been 30+ days past due on a payment in the past 2 years.
● pub.rec: The borrower's number of derogatory public records (bankruptcy filings, tax liens, or judgments).
● not.fully.paid: 0 indicates they have paid fully, 1 they have not paid fully.
Dataset for the second question: Suppose you are working as a data scientist for an Ecommerce company that sells clothing online but they also have in-store style and clothing advice sessions. Customers come in to the store, have sessions/meetings with a personal stylist, then they can go home and order either on a mobile app or website for the clothes they want. The company is trying to decide whether to focus their efforts on their mobile app experience or their website. They've hired you to help them figure it out! You have been given the customers-shop.csv dataset which contains the following information:
● Avg. Session Length: Average session of in-store style advice sessions.
● Time on App: Average time spent on App in minutes
● Time on Website: Average time spent on Website in minutes
● Length of Membership: How many years the customer has been a member.
Submissions on Moodle
This assignment has to be done using the Jupyter Notebook only. Your Jupyter Notebook has to use the Markdown language for proper formatting of the report and answers, with inline Python code (and graphs if applicable).
You are to hand in two files:
1. The Jupyter Notebook file (.ipynb) that contains a working copy of your report (using Markdown) and Python code for the data analytics.
2. A PDF file that is generated from your Jupyter Notebook. Execute your Python code, select “Print Preview”
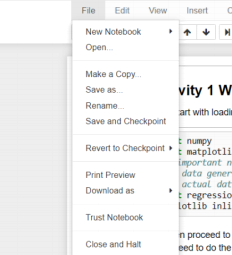
You will be presented with the output in your browser. If you are on Windows, you can then right click and select “Print” (similar function should be available on your Mac).
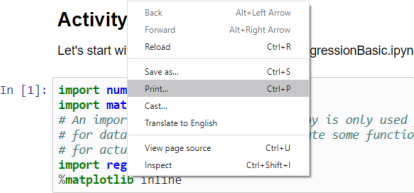
You should then be presented with a print dialog box, which should have a “Save as PDF” option instead of your printer.
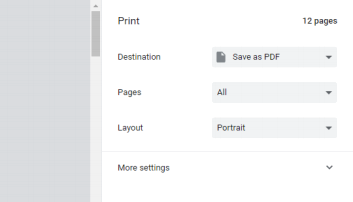
Save it as a PDF and submit this PDF file.
Note that there were some problems with some browsers to be able to do this properly, so do try out other browsers (Chrome works).
Clarifications
This assignment is not meant to provide step by step instructions and as per Assignment 1, do use the Moodle Discussion Forum so that other students can participate and contribute. For postings on the forum, do use it as though you are asking others (instead of your lecturer or tutors only) for their opinions or interpretation. Just note that you are not to post answers directly.
Assignment
This assignment is worth 40 marks, which makes up for 20% of this Unit’s assessment. This assignment has to be done using the Python programming language in the Jupyter Notebook environment. It should also be formatted properly using the Markdown language.
Tasks
You should start your assignment by providing the title of the assignment and unit code, your name and student ID, e.g.
Thereafter, you are to complete the following tasks:
Question 1:
1. Introduction
a. Start with an introduction to the assignment.
b. Importing the necessary libraries, read the file (‘loan_data.csv‘), and provide some description of the data you have read (you do not need to repeat the description given in this file for each field).
c. Create a histogram of not.fully.paid column on top of each other, one for each not.fully.paid outcome (0 and 1) as per their credit score fico.
d. Create a plot to show the relationship between fico and interest rate.
2. Supervised Learning
a. Explain supervised machine learning, the notion of labelled data, and the training and test datasets.
b. Separate the features and the label and mention what is your label.
c. Use the sklearn.model_selection.train_test_split function to split your data for training (80 %) and testing (20%).
3. Classification
a. Explain the difference between binary and multi-class classification and point what type of classification is your current problem.
b. Train a Decision tree and a Random Forest model (use this: from sklearn.tree import DecisionTreeClassifier, RandomForestClassifier).
c. Predict
i. Using the testing dataset you created in 2(c) above, conduct the prediction for the label (whether borrowers will pay back or not)
ii. Display the confusion matrix.
4. Conclusion
a. Conclude your assignment by comparing the performance of the investigated classifiers. Explain which one is performing better in your opinion.
Question 2:
1. Introduction
a. Start with an introduction to the assignment.
b. Importing the necessary libraries, read the file (‘customers-shop.csv‘), and provide some description of the data you have read (you do not need to repeat the description given in this file for each field).
c. Create a scatter plot to compare the Time on Website and Yearly Amount Spent columns. Does the correlation make sense?
d. Create a scatter plot to compare the Time on App and Yearly Amount Spent columns. Compare this correlation with corelation at part c.
2. Supervised Learning
a. Separate the features and the label and mention what is your label.
b. Use the sklearn.model_selection.train_test_split function to split your data for training (70%) and testing (30%).
3. Regression
a. Train a Linear regression model (to import the package use: sklearn.linear_model import LinearRegression) and report the coefficients of the regression model.
b. Predict
i. Using the testing dataset you created in 2(b) above, conduct the prediction for the ‘yearly-amount-spend’.
ii. Report the accuracy metrics (at least two metrics).
4. Conclusion
a. Conclude your assignment by stating which variable is more important for increasing the yearly-amount-spent. Is it better for the company to focus their efforts on their mobile app experience or their website?
Marking Rubrics
The marking rubrics is just a guideline and it may vary slightly depending on your approach.
|
Report
|
Appropriately formatted using Markdown (and
HTML) and content
|
1 mark – Good use of formatting codes
(Markdown or HTML)
2 marks - Good and easy to read submission,
including introduction and conclusion.
|
|
Tasks
|
Classification
|
1 mark – Importing libraries and reading file(s)
2 marks – Basic descriptive statistics of the
values in the corresponding file(s)
1 mark – explain supervised machine learning
and the notion of labelled data
1 mark – explain the training and test datasets
1 mark – code the split of the features and labels
6 marks – code for building and training the
model. (3 for RF and 3 for DT)
4 marks – Code the prediction using testing
data (2 for RF and 2 for DT)
4 marks – Code, output and explain the
confusion matrix (2 for RF, 2 for DT)
2 marks- Conclusion and comparison of results
|
|
Tasks
|
Regression
|
1 mark – Importing libraries and reading file(s)
3 marks – Basic descriptive statistics of the
values in the corresponding file(s)
3 marks – code and explain the split of the test
and train dataset
2 marks – Code and train the model
2 mark – report the coefficients
2 marks – Code the prediction using testing data
2 marks – Code, output and explain the
accuracy of data
2 marks- Conclusion
|
Have Fun!
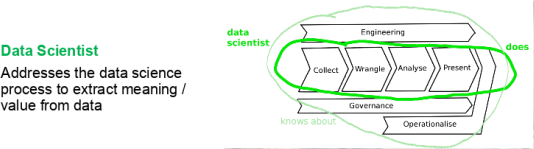
Upon completion of this assignment, you should have some experience with the Collect, Wrangle, Analyse and Present process that is core to the role of a Data Scientist (See Lecture 1, Data Science Process).
Congratulations!
By completing Assignment 1, you would have experienced looking, understanding, and auditing data. You would also have provided exploratory analytics using descriptive statistics and visualisation. In doing so, you would have had to spend some time sieving through the data to understand it. That was the intention to get you to experience it.
For Assignment 2, we skipped the data wrangling and moved to focus on preparing your data for analytics, conducting machine learning using available libraries to build various models, output your results and got the results to be independently evaluated.
You should now be ready to start to build a machine learning portfolio and this should give you an introduction to the role of a data scientist.
2021-09-16