STATS 769 Advanced Data Science Practice SEMESTER TWO, 2020
Hello, dear friend, you can consult us at any time if you have any questions, add WeChat: daixieit
STATS 769
SEMESTER TWO, 2020
STATISTICS
Advanced Data Science Practice
(Time allowed: TWO Hours)
INSTRUCTIONS
. Attempt ALL questions.
. Total marks are 70.
1. [10 marks]
This question relates to a CSV ile called "linux-prosper. csv". Theirst few lines of the ile are shown below. There are many more lines like this in the ile.

(a) Write a shell command that uses awk to extract just the id and province for the rows of the CSV ile for which the age column is an age range (i.e., the age column contains a dash character, like this: 40-89).
The irst few lines of output from your command would look like this:
000-1-10451 Saitama
000-1-10679 Tokyo
000-1-10680 Tokyo
000-1-10681 Tokyo
000-1-10682 Tokyo
000-1-10683 Tokyo
000-1-10684 Tokyo
000-1-10685 Tokyo
000-1-10686 Tokyo [5 marks]
(b) Explain what the following shell command is doing and write down the output from the command.
head -20 linux-prosper. csv | grep Tokyo | wc -l [5 marks]
2. [10 marks]
(a) The image below shows a web page located at the URL:
https://www. stat. auckland. ac. nz/stats769/2020/donations. html
|
Electoral Donations The table below shows the total amount donated to each political party (for the top four parties) in the lead up to the 2014 general election. Party Amount Donated National Party $1,260,000 Labour Party $670,000 Internet Party $230,000 Maori Party $220,000 |
The HTML code for that web page is shown below.
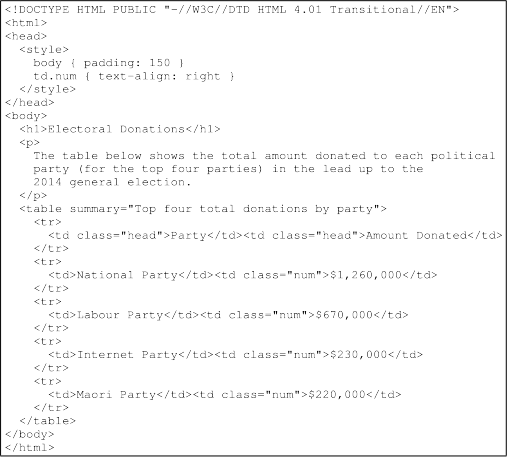
Write R code that uses the httr package to download the web page and uses the xml2 package, and one or more XPath expressions, to extract the numeric values from the table as a numeric vector.
Do NOT use the rvest::html_table() function for this question. The result of your code would look like this:
[1] 1260000 670000 230000 220000 [5 marks]
(b) This question relates to the ile covid. json, shown below.
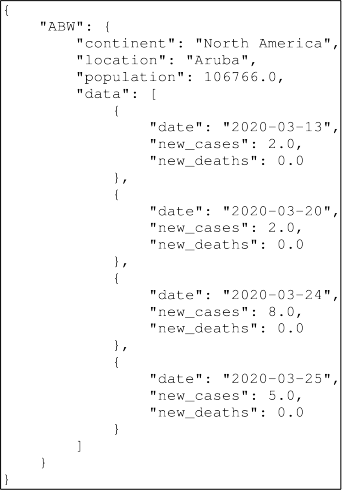
Write R code that uses functions from the jsonlite package to read the covid.json ile and to create a data frame containing the date, new_cases, and population values.
The output of your code would look like this:
date new_cases population
1 2020-03-13 2 106766
2 2020-03-20 2 106766
3 2020-03-24 8 106766
4 2020-03-25 5 106766 [5 marks]
3. [10 marks]
This question relates to a CSV ile called "linux-prosper. csv". Theirst few lines of the ile are shown below. There are many more lines like this in the ile.
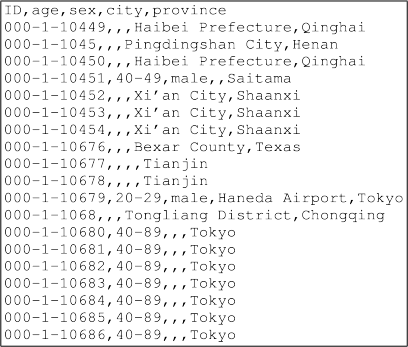
If the ile linux-prosper. csv has 1,000,000 rows and we read it into R with read. csv(), calculate a rough estimate of the size (in terms of bytes) of the resulting data frame.
Explain your calculation and describe any assumptions that you are making in your calculation. [10 marks]
4. [10 marks]
The following code reads a CSV ile into an R data frame and generates some new R objects from values in the data frame.
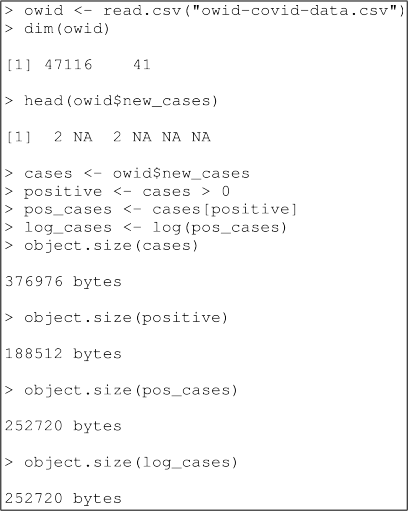
(a) Explain the size of each of the new objects (cases, positive, pos_cases, and log_cases). [5 marks]
(b) Write R code that performs the same task, but uses functions from the data.table package to read the CSV ile into a data. table object and uses the special data.table syntax to create a new column in the data. table that contains the logarithm of the new_cases column. [5 marks]
5. [10 marks]
(a) This question is based on a text ile, path. txt, that contains thousands of lines in the format shown below (a word, either moveto or lineto, followed by a space, followed by two numbers separated by a comma).
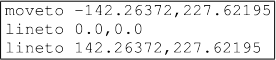
The R code below reads the ile path. txt and extracts the numbers, creating a numeric vector x with the irst number from each row and a numeric vector y with the second number from each row.
Identify any ine伍ciencies in the R code below and write new R code that performs the same task, but is more e伍cient.
> path <- readLines("path.txt")
> x <- numeric()
> y <- numeric()
> for (i in 1:length(path)) {
coords <- strsplit(path[i], " ")[[1]][2]
cx <- strsplit(coords, ",")[[1]][1]
cy <- strsplit(coords, ",")[[1]][2]
x <- c(x, as.numeric(cx))
y <- c(y, as.numeric(cy))
}
> head(x, 3)
[1] -142.2637 0.0000 142.2637
> head(y, 3)
[1] 227.6219 0.0000 227.6219 [5 marks]
(b) Explain what each expression in the following R code is doing and why the two time measurements shown in the output are diferent.
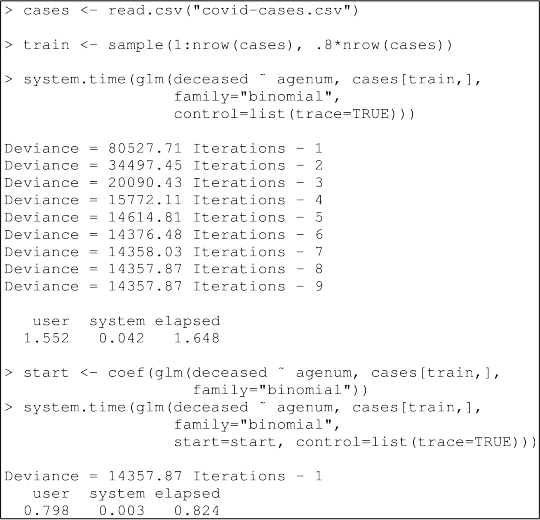
[5 marks]
6. [10 marks]
The following R code and output shows the execution time for three diferent sets of code that all produce exactly the same result.
> system. time(m1 <- mean(sapply(1:10, f)))
user system elapsed
16.789 0.065 16.853
> system. time(m2 <- mean(unlist(mclapply(1:10, f, mc. cores=10))))
user system elapsed
18.895 3.276 2.860
> system. time({
cl <- makeCluster(10)
clusterExport(cl, c("x", "y"))
m3 <- mean(unlist(parLapply(cl, 1:10, f)))
stopCluster(cl)
})
user system elapsed
0.251 0.091 3.053
> m1 == m2 && m2 == m3
[1] TRUE
Explain the diferences in elapsed and user time between the three sets of system. time() output.
Also explain the purpose of the clusterExport() function call and suggest why this may be necessary.
It is NOT necessary to know what values have been assigned to the symbols f, x, and y in order to answer this question. [10 marks]
7. [10 marks]
This question relates to a data frame, covid, with two columns, age and outcome. There are many thousands of rows in the data frame, but just the irst few rows are shown below.
> head(covid)
age outcome
1 critical condition, intubated as of 14.02.2020
2 78 death
3 61 discharge
4
5
6
The code below performs calculations with the values from the covid data frame using functions from the rmr2 package. Some set up code has been left out for simplicity.
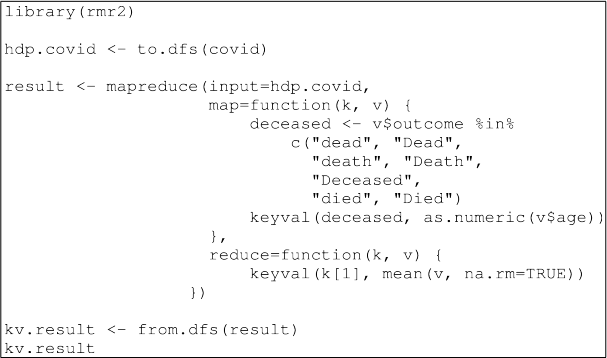
(a) Explain what each expression in the code is doing. [5 marks]
(b) Write down what the output of the code would look like. You will not be able to know all of the exact values, but you can describe the overall structure of the output and what types of values will be returned.
Write R code that would perform an equivalent calculation using only stan- dard R functions (no functions from add-on packages). [5 marks]
2023-10-17