ADM2303 Assignment 1 Part II Fall 2023
Hello, dear friend, you can consult us at any time if you have any questions, add WeChat: daixieit
ADM2303
Assignment 1 Part II
September 11, 2023
CATEGORICAL DATA AND CONTINGENCY.
Preface: A retail chain (with many outlets), Floor to Ceiling Market (F2CMarket ), relies on “background-check agencies” (BCA’s) to screen-out “theft-risk” (TR) job applicants. A BC finding of TR predicts that an employee would steal from the store. BCA predictions have two possibilities, namely TR (theft risk) or nTR (not Theft Risk). Reliance upon BCA’s is controversial because of false positives, which occur when honest, upstanding, candidates are incorrectly flagged TR by the BCA: the probability of a false positive is determined as Pr[TR | I] where I connotes innocent, and TR connotes predicted to steal.
A data-table1 is provided. The data-table allows us to compare the algorithm predictions (the factor BCApred) with the actual outcomes (the factor Convict). It includes data on 2700 employees, captured by four variables: Convict which is labelled Yes(G) if employee was convicted (i.e., guilty) of theft and No(I) if not (i.e., innocent); sex with levels of female or male; eclass having three levels reflecting socioeconomic status (1,2,3) with 1 being the most advantaged and 3 being the least advantaged; and finally BCApred with two levels namely (TR) and (nTR) as already discussed.
The first two questions will ignore the variables sex and eclass (and thus will be un- conditional upon these two variables).
1. BCA Data-set summaries
(a) Construct a contingency table for the factors convict (two levels) versus BCApred (two levels). Please include the margins (i.e., subtotals/totals) in the table.
i. (3 points) Display the table in frequency form
ii. (2 points) Display the table in relative frequency form (retaining the margins).
(b) (1 point) Drawing from your table identify the marginal probability that a ran-
domly chosen employee would be convicted of theft (i.e., “Yes(G)”). Use suitable notation to identify this probability.
(c) Consult your relative frequency contingency table to determine the following. Show your logic (as done in class).
i. (2 points) Consider the probability of being labelled theft risk for those em- ployees who are tagged as guilty. Does this represent a joint probability or a conditional probability? Calculate this probability
ii. (2 points) What is the probability of being labeled “theft risk” among those innocent (i.e., not convicted, aka not guilty)?
2. A different retail chain W2WAppliance (sells larger more difficult to steal items) asks you to tailor an analysis for their context, making use of the conditional probabilities determined from F2CMarket BCA data, but tailoring the probability that a randomly chosen employee would be convicted to better reflect their context: for this purpose they assert that 1 out of every 40 employees will end up committing a theft. So that Pr[Yes(G)] = 1/40. Use this result along with the conditional probabilities calculated in Quest-1 for your solutions to sub-questions that follow.
(a) (2 points) What is the probability that a randomly chosen applicant would be: labeled “theft risk” by a BCA ?
(b) Given that a person is labeled “theft risk” what is the probability that they will actually be (over the course of their employment with retailer):
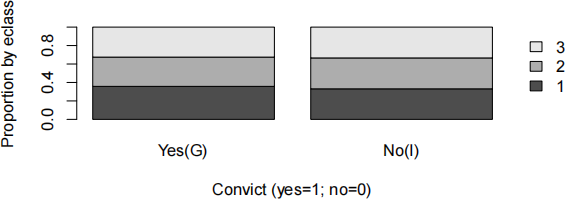
Figure 1: Stacked (or Segmented) barplot comparison of distribution of eclass by the two levels of convict
i. (2 points) ...innocent?
ii. (1 point) ...guilty?
(c) (2 points) Would you recommend implementing the BC policy, which would involve conducting a BCA and screening out all those labelled as “theft risk” by the BCA?
(d) (2 points) If policy was implemented what is the probability of it coming up with at least one false positive if it were applied to 5 innocent employees?
3. Returning to the BCA dataset, we are interested in the relationship between the variable eclass and BCApred.
(a) (2 points) Use a stacked/segmented barplot to examine the relationship between these two factors. Label the display appropriately.
(b) (2 points) What does your stacked/segmented barchart reveal about the relation- ship between eclass and BCApred? (i.e., are these events disjoint, independent?, and if so, how so.)
(c) (1 point) Examine the stacked/segmented barchart displayed in this assignment statement (Fig 1). It explores the relationship between eclass and convict. What can you conclude regarding this relationship?
(d) (2 points) Contrast the findings discussed in part b above (i.e., BCA prediction versus eclass) with discussed in part c above (i.e., convict versus eclass).
2023-09-22