ETC2420/5242: Statistical thinking
Hello, dear friend, you can consult us at any time if you have any questions, add WeChat: daixieit
ETC2420/5242: Statistical thinking
Assignment 1
Specific instructions for ETC2420
The assignment must be submitted as a pdf file. All code must be available and neatly formatted. It should be clear that the code submitted produces the analysis in the report.
It is suggested that you prepare the report reproducibly by using RMarkdown, setting the seed, and generating all of the plots and tables. However, we will accept a report prepared in Word or another word-processing system as long as
1. The code is included in the report as appropriate.
2. All of the code is also submitted as a separate .R file that is cleanly structured and, when run, produces all of the output in the assignment.
3. It is clear which code produces which results.
The assignment will be marked out of 30 (25 for 3 people groups).
● 5 marks for the writing and formatting of the report. The report should be written in complete, clear sentences. All answers should be explained fully. All graphs should have meaningful labels and titles.
● 5 marks for Questions 1
● 5 marks for Question 2
● 5 marks for Question 3
● 5 marks for Question 4 (only for 4 person groups)
Specific instructions for ETC5242
The assignment must be prepared using RMarkdown and submitted as a pdf. All analysis code should be available. Extraneous messages should not be outputted. It is preferred that you knit directly to pdf, but you won’t lose marks from converting from pdf as long as the results are legible.
Students in ETC5242 must complete the indicated extra exercises as part of the group assignment.
The assignment will be marked out of 35 (30 for 3 person groups)
● 5 marks for the writing and formatting of the report. The report should be written in complete, clear sentences. All answers should be explained fully. All graphs should have meaningful labels and titles.
● 5 marks for Questions 1
● 5 marks for Question 2
● 5 marks for Question 3
● 5 marks for Question 4. (only for 4 person groups)
● 5 marks for Question 5.
Background
Customer churn time is the length of time a customer stays with a company before leaving. This is a vital metric in many businesses and there is great interest in estimating it.
The churn time changes, so we always want to estimate it with the most recent data available. This is statistically challenging as many (hopefully most) customers will have not churned at the time when the data is collected. This means that customer churn data is highly censored.
In this assignment we are going to look into aspects of analysing churn data.
We will use the following data (remove the line break!). Note: It is important to remove the rows with months_active == 0.

We will be interested in 3 columns:
● months_active: The churn time
● churned: The censoring indicator that is 1 if the customer churned and 0 if the measurement is censored (aka they were still customers when the data was pulled)
● company_size: A categorical variable with the size of the client’s company.
Question 1
● Write a function that takes a survival pair (time, event) and uses it to compute the Kaplan-Meier estimate of the survival function. It should work for any survival data. This function should be written using only base R and the Tidyverse and should not use the survival package or any other package for computing Kaplan-Meier curves or related quantities.
● Use this function and ggplot2 to plot:
– The Kaplan-Meier curve for the full data
– The Kaplan-Meier curve for each company_size
● Write a few sentences describing and interpreting the curves.
To achieve full marks, the graphs must be properly labelled, and have meaningful axis names. The code must be written in idiomatic R style with reasonable line breaks. See Sections 4 and 5 of the Tidyverse style guide for information.
There are many possible ways to program up the function for computing the Kaplan-Meier curve. Two functions that could be helpful are the accumulate and accumulate2 functions from the purrr package.
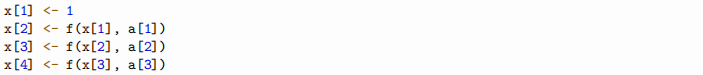
These are used to apply a function recursively along a list. For example, if f <- function(x, a){...} is a function, then

is, if a has 3 elements equivalent to
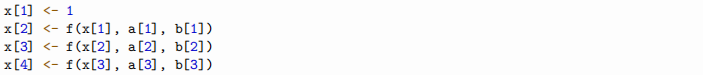
The function accumulate2 works similarly, except it takes two vectors. For example, if f <- function(x, a, b){...} is a function, then

is equivalent to
Question 2
For each company size (as measured in the company_size column):
● Compute the Kaplan-Meir curve and use this to estimate the median churn time.
● Use a non-parametric bootstrap to construct 90% confidence intervals for the median of each company size
● Make a plot that shows that estimate of the median and the corresponding confidence interval on the same axes
● Write some sentences describing how the median churn time changes across company sizes.
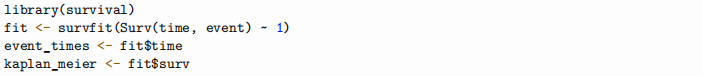
While you will ideally use the Kaplan-Meier function you produced in question 1, you will not be marked down for using the survival::survfit function. If your data is (time, event), then you can get the estimated survival curve with the following code.
Question 3
For one of the company sizes in the data, do the following.
● Use a nonparametric bootstrap to re-sample the data and construct 90% confidence intervals for the survival curve at each time.
● Compute simultaneous coverage for the entire survival function. That is, the the probability that the true survival function is entirely contained between the piecewise constant functions you get by connecting the lower and upper confidence intervals for each event time.
● Write a few sentences detailing your results and comparing them to the results in the previous question.
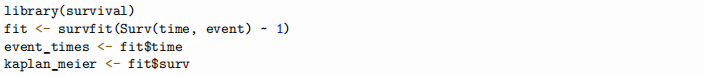
While you will ideally use the Kaplan-Meier function you produced in question 1, you will not be marked down for using the survival::survfit function. If your data is (time, event), then you can get the estimated survival curve with the following code.
Question 4 (4 person groups only)
In this question, we are going to explore the idea of a permutation test. A permutation test is useful for identifying if two samples come from the same distribution.
To explain the process, let’s imagine we want to test the null hypothesis that $T(x,y) = 0 $ for some samples x and y. A permutation test is similar to a bootstrap in that we use our observed samples to create new samples. The difference is that instead of sampling with replacement, we permute the entries of the vector.
The procedure to make one permutation sample of the test statistic is as follows:
● Make a new vector z <- c(x, y)
● Draw a vector of the same length without replacement

● Separate z_star into two vectors
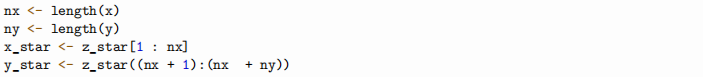
● Compute the test statistic from the permutation sample

The distribution of Tstar under repeated permutation is approximately the distribution of the test statistic under the null hypothesis.
Assume we have 2 populations i = 1, 2 and we want to test the null hypothesis that they have the same survival function. Let the joint event times be tj ordered in ascending order. For the ith population at the jth event time, population i has  events from a population of
  . (If population i did not have an event at time j, then
  = 0)
= 0)
We want to make a test to see if the survival curve for population 1 and 2 are the same. To do this, we define a test statistic as follows. Let
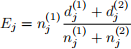
and
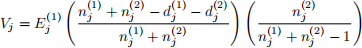
The test statistic
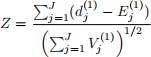
is called the log-rank test statistic.
● Write a function to compute the log-rank test statistic for two populations.
● Use a permutation to compute the distribution of the test statistic for populations with company size = of 50-100 and 100-250 under the null hypothesis that they have the same survival curve.
● The Central Limit Theorem says that Z is approximately N(0, 1) when J is large enough. Write a paragraph comparing the permutation confidence intervals to the CLT confidence intervals and use this to draw conclusions about whether or not the churn rate is different between these two company sizes.
You can use either the techniques in question 1 or the survfit function to compute  and
and  .
.
Question 5 (Students enroleld in ETC5242 only).
● Using the survival::survreg function, fit a Weibull distribution to the survival data.
-Use the fitted distribution to estimate the mean and the median of the churn time for each company size
● Use a parametric bootstrap (see note below) to construct confidence intervals for these.
● Write a paragraph describing how these estimates differ from the ones derived from the Kaplan-Meier curve.
Note: The survival::survreg function uses a strange parameterisation of the Weibull distribution (ie not the same one as rweibull). The code below shows you how to fit a weibull distribution to survival data and extract the shape and scale parameter that be used for rweibull.

2021-09-09