GSBA 511 Fall 2023 Problem Set 3
Hello, dear friend, you can consult us at any time if you have any questions, add WeChat: daixieit
GSBA 511
Fall 2023
Problem Set 3
Due by 5:00pm on Friday, September 15th
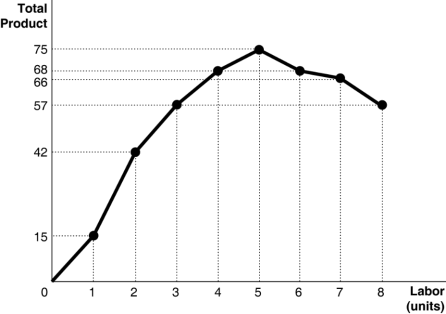
1. The figure above shows the relationship between labor and output (total product) for a firm, holding constant other factors of production.
a. What is the average product of the 2nd worker?
b. What is the marginal product of the 3rd worker?
c. For what quantities of labor is the marginal product decreasing?
d. Briefly explain why we expect to see the marginal product of labor decrease, holding other factors of production constant.
2. Suppose that in 1999 Mustang, Inc. produced 100 million units of a good at an average cost of $6 and in 2000 it expanded its plant capacity and produced 200 million units at an average cost of $6.20. In this
range, most likely Mustang is experiencing
(Select One)
a. economies of scale.
b. diseconomies of scale
c. neither economies of scale nor diseconomies of scale.
d. increasing marginal product of labor.
e. falling input prices.
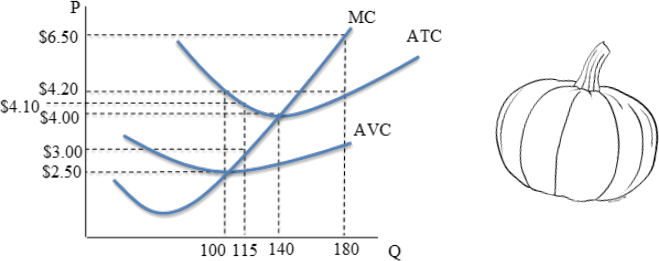
3. The graph above represents the cost curves of an individual firm in the perfectly competitive market for pumpkins. The current market price for pumpkins is $6.50.
a. How many pumpkins will the firm produce to maximize profits in the short-run?
b. What is the lowest price at which this firm will earn positive profit in the short-run?
c. What is the lowest price at which this firm will continue to operate, producing a positive quantity of pumpkins, in the short-run?
d. If there is no change in demand in the long-run, explain what you expect to happen to the market price in the market for pumpkins.
4. Alex runs a successful ice cream shop. Most of the week the shop is packed, but demand for ice cream is
lower on Tuesdays. If Alex opens the shop on Tuesdays, he expects to have only about 35 customers. To
stay open, he must staff the shop with one employee, who is paid $90 per day. The fixed cost of running the shop works out to $60 per day, including rent and equipment costs. The ice cream cones sell for $3 above
the cost of ingredients, so MR = $3. What should he do?
5. The graphs below show the market supply and demand curves for smart phones as well as the cost curves for an individual firm that produces smart phones. Assume that the market for smart phones is perfectly competitive and all the firms have identical cost curves.

a. What is the short-run market equilibrium price of smart phones?
P =
b. How many smart phones will each individual firm produce in the short run?
Q =
c. Calculate short-run profits (or losses) for the individual firm. Label the area representing profit (or loss) on the graph above.
π =
d. Explain what will happen to supply in the market for smart phones in the long run. How will this affect profit for the individual firms in the market?
e. What is the long-run, equilibrium price in the market for smart phones?
6. When a monopolist faces a downward sloping demand curve, marginal revenue is
(Select One)
a. equal to price.
b. equal to average revenue.
c. less than price.
d. more than price.
7. A monopolist has determined that at the current level of output the price elasticity of demand is -0.15. Which of the following statements is true? (Select One)
a. The firm should cut output.
b. This is typical for a monopolist; output should not be altered.
c. The firm should increase output.
d. The firm is maximizing profit if the price is P=0.15.
e. We need more information to answer this question
8. Suppose that a monopolistic firm faces the following costs, and market demand.
Demand: P = 80 – Q
Marginal Cost: MC = 20 + 3Q
a. Graph the demand and marginal cost curves.
b. Write down the equation of the marginal revenue curve and show it on the graph.
c. Find the profit maximizing price and quantity for the monopolistic firm.
d. What is the Learner index in this market? What does it tell you about the elasticity of demand?
e. What quantity would be produced if this were a competitive market made up of many identical firms with the same aggregate production costs as the monopolistic firm?
f. Calculate the deadweight loss that results from the firm’s market power, and label it on your graph.
2023-09-14