IB1210 Quantitative Analysis for Management I Summer 2019
Hello, dear friend, you can consult us at any time if you have any questions, add WeChat: daixieit
IB1210
Summer 2019
Quantitative Analysis for Management I
Question 1(50 marks)
A large technology company is evaluating its recruitment process. Since the company
receives a huge number of job applications each year, the management team are working with human resources (HR) to find ways to quickly sift through candidates to identify those to
invite to its intensive assessment centres. The focus here is on the recruitment of technical staff who are qualified to at least degree-level.
One of the HR representatives suggests giving candidates an IQ test as part of an initial
selection day as she recalls reading that having a higher IQ is associated with better job
performance in technical roles. The company management are willing to consider this but want to undertake some in-house investigations first. As such, a random sample of 325
employees who work in technical roles in the company were asked to undertake an IQ test and a company data analyst produces the histogram in Figure 1.1 below.
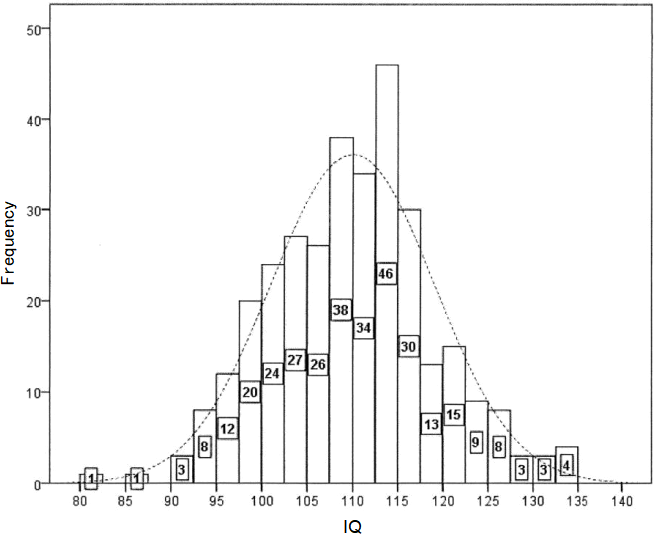
Figure 1.1: IQ scores of 325 company employees who work in technical roles. The numbers
superimposed on each bar show the number of people with IQ scores in the interval represented by the bar.
a) Looking at the histogram in Figure 1.1 on the previous page, it is clear that the IQ scores of the 325 employees are approximately Normally distributed. By using the information in Figure 1.1 and any relevant properties of the Normal distribution, estimate the mean and standard deviation of the IQ scores of the 325 employees. Clearly justify your answers, stating any assumptions made and showing any
calculations undertaken.
Note:you must make use of distributional assumptions to answer this question rather than attempting to calculate the mean and standard deviation from scratch.
(Put your answers in the box below and continue in the box on the next page if you need more space). (9 marks)
In order to explore the IQ data further, the company analyst splits the 325 technical
employees into two groups (Group A and Group B). Group A contains employees with
lower-level technical roles such as technicians and basic programmers, whereas Group B
contains employees with higher-level technical roles such as expert programmers and specialist engineers. The analyst produces the box plots in Figure 1.2 below.

Figure 1.2: IQ score by technical job classification (Group A or Group B);n=325.
b) By looking at the box plots in Figure 1.2, discuss the IQ scores of employees in the two groups, A and B. You should pull out any relevant statistics as well as drawing comparisons between the two groups.
(Put your answer in the box ON THE NEXT PAGE). (10 marks)
As part of the annual review process, the company assigns an integer score from 0 to 100 to each employee to rate their job performance, with higher scores loosely indicating better
performance. The score is constructed by taking account of a range of job elements. The analyst obtains the most recent performance scores for the 325 technical employees and investigates them alongside their IQ scores. To do this, she constructs Table 1.1 below:
Table 1.1: IQ against job performance;n=325.
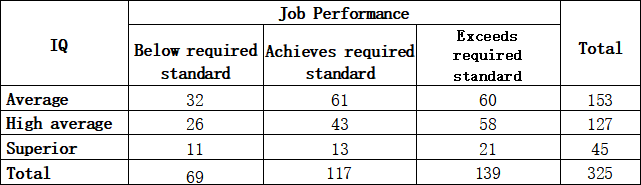
In order to construct Table 1. 1, the analyst categorised the data for IQ and job performance as shown below. The cut-points for IQ were selected after reviewing relevant literature' and the cut-points for job performance were decided in consultation with company management.

The analyst starts to undertake a chi-squared test to investigate whether there appears to be an association between IQ and job performance, but she gets interrupted halfway through. Her
initial steps and calculations are shown in Figure 1.3 over the page.
Figure 1.3: Initial steps of the chi-squared test to investigate if there is an association between IQ and job performance.

c)Complete the chi-squared test that the analyst has started, as shown in Figure 1.3 above. Show all steps of your calculations, including any formulas used. There is no need to repeat any step or calculation already detailed above.
(Put your answer in the box ON THE NEXT PAGE. You may write missing expected frequencies in the table in Figure 1.3 above if you wish.) (10 marks)
The analyst decides to undertake another hypothesis test to investigate whether average (mean) performance score differs between the two groups (Group A and Group B). As
detailed previously, Group A represents employees in lower-level technical roles and Group B represents employees in higher-level technical roles. She computes the following statistics from the sample of data:
Table 1.2: Sample statistics relating to performance scores for Groups A and B (n=325).

d)By thinking about what is being compared, and looking at relevant information in Table 1.2, state the hypothesis test that has been undertaken. Obtain the P value for the test and carefully interpret the result. Show all steps of your working.
(Put your answer in the box below and continue in the box on the next page if you need more space). (7 marks)
e) A 95% confidence interval for the difference between mean performance scores in groups A and B is shown in Table 1.2 and is given as (1.9,9.4). Using this information and any other relevant information from Table 1.2, derive the standard error used to obtain the 95% confidence interval. Show all steps of your calculations and clearly state any formulas you use.
(Put your answer in the box below and continue in the box on the next page if you need more space). (8 marks)
f) After reviewing the reported statistics in Table 1.2 again, the analyst is not happy with the hypothesis test she has undertaken to compare the mean performance scores
between Group A and Group B. She realises that she didn't explore the data
thoroughly enough beforehand and the test might not be suitable. Clearly stating any
evidence from Table 1.2, discuss why she has reached this conclusion. (Put your answer in the box below). (6 marks)
Question 2(35 marks)
Ryan Sinclair is an MBA student at a UK business school. He is completing the course on a part-time basis, alongside working as a Database Manager at a large multi-site organisation which employs more than 6000 people. To complete his MBA, he is undertaking a research project to investigate factors that affect a person's sense of well-being in the workplace (i.e.
how comfortable and happy a person feels at work). In order to investigate this he has
recruited a sample of 78 employees from within his department at his place of work. Each person was asked to complete a well-being questionnaire from which a score was derived based on their responses. The score ranges from 0 to 40, where a score of 40 indicates a
complete sense of well-being at work (i.e. the person feels very happy) and a score of 0
indicates complete dissatisfaction at work (i.e. no sense of well-being). He originally asked all 124 members of his department to complete the questionnaire and the 78 people
mentioned above are those who fulfilled the request. As well as obtaining the questionnaire data, Ryan obtained additional data on each respondent including their length of employment at the company (years) and their gender (male or female).
When writing up his project, Ryan stated the aim of his research as follows. He did not elaborate further on the details of this aim in his dissertation:
"The aim of this research is to investigate factors that affect a person's sense ofwell-being in the workplace."
a) By looking at the statement above, deduce Ryan's population of interest. Assuming that this statement accurately represents his research aim, and also considering the data Ryan collected for his research, critically appraise the design of his study and comment on its generalisability.
(Put your answer in the box below and continue in the box on the next page if you need more space). (6 marks)
Ryan begins to explore and analyse the data he has collected and produces the scatter plot shown in Figure 2.1 below.
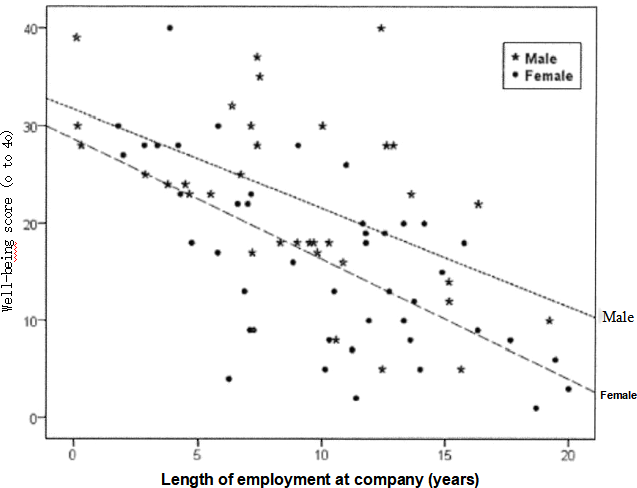
Figure 2.1: Well-being score against length of employment for male and female employees (female,n=44; male,n =34).Separate fitted regression lines are superimposed on the plot
for males and females.
b) By looking at the scatter plot in Figure 2. 1, estimate the minimum and maximum
well-being scores for males and females separately.
(Put your answer in the box ON THE NEXT PAGE). (3 marks)
Ryan wants to investigate the impact of gender and length of employment on well-being
score. He knows that he could use a multiple regression model, but he's not quite sure how to do that. As such, he decides to fit two separate simple linear regression models, one for males and one for females, to look at the impact of employment length (x) on well-being score (y)
for each gender. Figure 2.2 shows selected output from one of these analyses, namely the regression analysis to investigate the impact of employment length on well-being score for males. The fitted regression lines from both models have been superimposed on the scatter plot in Figure 2.1 on the previous page.
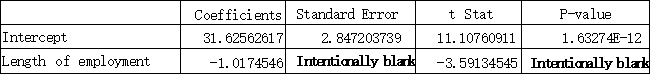
Figure 2.2: Selected Excel output from a simple linear regression of well-being score (0 to 40) on length of employment(years) for males;n=34.
Answer the questions relating to this output over the page .
c) By looking at the output in Figure 2.2 on the previous page, write down the equation of the fitted regression model for males.
(Put your answer in the box below). (2 marks)
d)Using your answer to part c) above as a guide, and by looking at the fitted regression lines in Figure 2. 1, deduce the approximate equation of the fitted regression line for females, carefully justifying the value you choose for the estimated slope.
(Put your answer in the box below). (4 marks)
e) Using relevant outputs from Figure 2.2, calculate a 95% confidence interval for the slope of the regression line for males. Show all steps of your calculations, including any formulas used.
(Put your answer in the box below). (8 marks)
After carrying out the above analysis, Ryan starts to question why the well-being scores for the female employees appear to be lower, on average, than those for male employees. He
decides to collect some more data and asks each of the original 78 questionnaire respondents
the question,"In your opinion, have you experienced bullying in the time you have been
employed at this company?"He produces the summary statistics shown in Table 2.1 below.
Table 2.1:Experiences of bullying at the company according to gender and length of employment (n=78).

f) Using the information in Table 2. 1, write a short report to discuss the employees' experiences of bullying according to gender and length of employment at the
company. Your report should be written in an informative way, as Ryan would be expected to write his dissertation, and suitable for an educated but non-statistical
audience. In particular, you should link back your observations to Ryan's assertion that well-being scores appear to be lower for women. Does Table 2.1 provide any evidence to explain this?
(Put your answer in the boxes ON THE NEXT TWO PAGES) . (12 marks)
Question 3(15 marks)
Dr Robin Scherbatsky is a Data Mining Analyst at a defence company. As part of her role she oversees the quantitative training of new graduate employees and interns. In order to gauge
their levels of knowledge, Robin asks the incoming graduates and interns to complete some reading and exercises in statistics before commencing their employment at the organisation. She enrols you, a junior analyst, to help to prepare some of the materials. In particular,she would like you to produce a solutions booklet to accompany the exercises.
In each of the exercises below, you should produce a comprehensive solution, bearing in mind that the new employees should be able to understand exactly how you derived the answers so that they can learn from the feedback.
a) The salary offered to graduate trainees commencing employment in the defence sector in the UK follows an approximately Normal distribution with mean f21,500 and standard deviation f3,300.
If a random sample of 60 graduate trainees from this sector is selected, what is the probability that their mean salary is less than or equal to f21,000? Show all steps of
your calculations, with clear justification where necessary, and include any formulas used.
(Put your answer in the box below and continue in the box on the next page if you need more space). (10 marks)
b) Let A and B be two events of interest. A and B are not mutually exclusive. Suppose that P(A)=0.7,P(B)=0.25 and P(AnB)=0.1.
i)Calculate P(An B°). Show all steps of your calculations, including any formulas used.
ii) Are the events A and B independent? Justify your answer.
(Put your answers in the box below) (5 marks)
2023-09-14