MCB 136, Fall 2023: PRACTICE PROBLEM SET 2
Hello, dear friend, you can consult us at any time if you have any questions, add WeChat: daixieit
MCB 136, Fall 2023: PRACTICE PROBLEM SET 2
Due Thursday Sept. 14th by 5:00 pm; 5 Points
Instructions: Please Read All Carefully
1. This Practice Set is designed to mimic a typical midterm exam. Problems earn points based on your effort in fully and specifically answering the questions. Blank, generic or irrelevant answers will not earn points. Carefully read through each question before you start working on the problem set. There are two questions.
2. Some questions can be interpreted in different ways and there could be several correct answers.
3. This is an open note/book problem set. You may consult online resources, lecture notes and optional reading. You may consult with your peers and study groups, but you must submit your own independent answers.
4. Your answer must be written within the box provided AND your uploaded exam must match the template – questions and answers must be on the same page, in the same place. You can type an answer using 10– 12-point font online. Or you can print the problem set and write your answers using clear handwriting that is no smaller than the problem set font. Illegible answers and information written outside the box (or not on the blank) will not be graded.
*Problem sets not matching the template will lose points as a result.
5. This problem set has a class-wide deadline. The deadline is Thurs. Sept. 14th by 5 pm.
6. You must convert your problem set to a pdf and submit via gradescope at least 15 minutes before the deadline. Late submissions will be eligble for half credit.
Problem Set 3: The Nernst Potential for Potassium (EK) and Membrane Excitability
Access the U. Chicago Nerve simulator at:http://nerve.bsd.uchicago.edu/nervejs/MAP1.html
Question 1. 3 pts
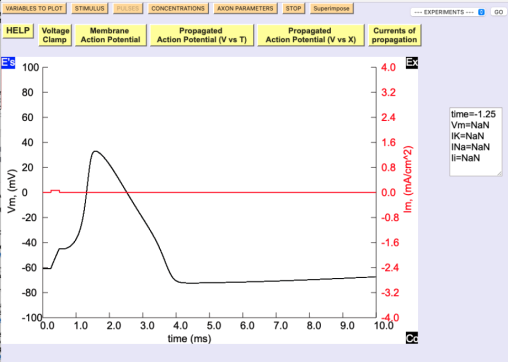
A. Choose the yellow “Membrane Action Potential” button. The black trace shows the membrane voltage (Vm in units of mV) for a single AP. The red trace shows the stimulus current (Im, in units of current per membrane area [mA per cm-2]) that is injected to trigger the AP. The AP should look like this:
B. Click the “STIMULUS” button
C. Initially you should see:
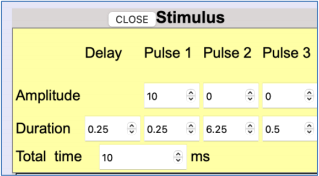
D. Change the following parameters:
Amplitude: 5
Delay: 1.0 ms (far left box near “Duration”)
Total time: 30 ms
E. Display the resulting AP below. You may insert a screenshot or draw the AP. Be sure to include x- and y-axes with labels and units. Accurately depict the values indicated in G. (0.2 pt)
F. Estimate the following values to two (2) significant digits. Remember to include units and to indicate valence (+ or -). (0.6 pts)
1) Resting Membrane potential (Vrest):
2) AP Threshold (in mV):
3) Peak of the AP (in mV):
4) Time to AP peak (in ms):
5) Maximum after-hyperpolarization (in mV):
6) EK (in mV; set up the equation and show your work):
G. At the upper left, hit the “ CONCENTRATIONS” button. This button will allow you to change the ionic concentrations of the external (extracellular) solution and the internal (cytosolic) solution.
H. Click the “Superimpose/NO superimpose” button to display “NO Superimpose.” This will show two APs at a time. To reset the graph, click the button twice. To show only one AP, make sure the button displays “Superimpose” .
I. Set the [K+]external to 15 mM.
J. Examine the new AP and the previous AP (in 10 mM external K+).
K. For the new AP, estimate the following values to two (2) significant digits. Remember to include units and to indicate valence (+ or -). (0.6 pts)
1) Resting Membrane potential (Vrest):
2) AP Threshold (in mV):
3) Peak of the AP (in mV):
4) Time to AP peak (in ms):
5) Maximum after-hyperpolarization (in mV):
6) EK (in mV; set up the equation and show your work):
L. Compare the shapes of the two APs and the values you estimated in F and K.
1) Describe two features of the AP waveforms that stayed the same and two features of the AP waveforms that differ (0.8 pts)
2) How did increasing external [K+] by 5 mM change EK? Describe the change both quantitatively and qualitatively. (0.4 pt)
3) Why did increasing external [K+] by 5 mM cause this change in the AP? (0.4 pt)
Question 2. (2 pts)
A. All parameters should be set as above, with [K+]external=15 mM.
B. Click the “Superimpose/NO superimpose” button to rest the graph, and then display “NO Superimpose.”
Your graph should show a single AP, which corresponds to the one with the values you measured in L. C. Set the [K+]external to 25 mM.
D. Examine the new AP waveform (in 25 mM K+) and the previous AP (in 15 mM external K+).
E. Display the resulting graph below. You may insert a screenshot or draw the AP. Be sure to include x- and y-axes with labels and units. (0.4 pt)
F. Compare and contrast the two waveforms.
1) Describe one feature of the AP waveforms that is similar and two features of the AP waveforms that differ (0.6 pts)
2) How did increasing external [K+] by 10 mM change EK? Describe the change both quantitatively and qualitatively. (0.5 pt)
3) Why did increasing external [K+] by 10 mM cause this change in the AP? (0.5 pt)
2023-09-13