Big Data and Machine Learning for Economics and Finance Assignment 2
Hello, dear friend, you can consult us at any time if you have any questions, add WeChat: daixieit
Assignment 2
Big Data and Machine Learning for Economics and Finance
|
Submission Rules: . Provide your answers in a document generated by RMarkdown (html files are preferred). For each answer, provide 。 the R code, 。 the R output, 。 and your comments on the output. Comment each line of your R code as well. Give thorough explanations throughout. Please note that a document not generated by RMarkdown will not be considered as an acceptable submission and will receive nil marks. . Please note that the function set.seed() may not be used at any time in the assignment. . Please note that, when providing your answers, you may not use any extra packages other than the ones explicitly mentioned in each exercise. For example, if the question says “the only extra packages allowed are ISLR2 and boot” , then you may type library(ISLR2), and library(boot) when writing your answers to the questions in that exercise, but you may not type library(MASS) or library(any other package ) anywhere in your submission. |
This assignment contributes 33% to your final mark and it has 4 exercises in total.
Exercise 1. (20 points) For this exercise, the only extra packages allowed are ISLR2 and boot. The dataset NYSE will be used throughout the exercise and is accessible through the ISLR2 package. We will only look at the variables DJ_return, log_volume and log_volatility in this exercise, and we are interested in predicting DJ_return.
Using 10-fold cross-validation, choose the best input subset among all 4 possible input subsets. Explain thoroughly how the procedure works and justify your reasoning.
Exercise 2. (25 points) For this exercise, the only extra packages allowed are ISLR2 and boot. The dataset Boston will be used throughout the exercise and is accessible through the ISLR2 package. Using medv as output, and everything else as input, we are interested in the standard error of the coefficient corresponding to the “proportion of residential land zoned for lots over 25,000 sq.ft.” variable.
Consider the following figures:
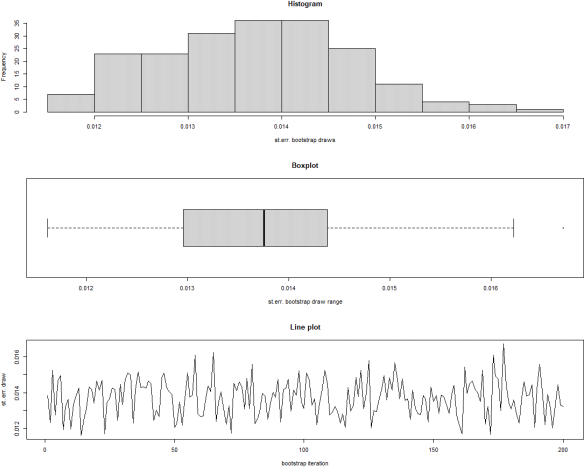
Figure 1. Three plots representing the bootstrap output.
Write R code that reproduces the figures as closely as possible. In case of discrepancy, explain why your figures are different.
Exercise 3. (25 points) I asked chatGPT multiple questions and I got the following answers:
1. Question: Why is Monte Carlo simulation a special case of the bootstrap method? Answer:
Monte Carlo simulation and the bootstrap method are both resampling
techniques used in statistics, but they serve somewhat different
purposes.
Monte Carlo simulation involves generating random samples from known
probability distributions to estimate complex statistical quantities or
simulate real-world processes. It's a broader technique used for various
statistical and computational purposes, including solving problems where
analytical solutions are challenging or impossible to obtain.
On the other hand, the bootstrap method is specifically designed for
estimating the sampling distribution of a statistic by resampling from
an observed sample. It helps estimate the variability and confidence
intervals for a statistic.
However, you can view Monte Carlo simulation as a special case of the
bootstrap in situations where you're simulating data based on a known
distribution. In this case, the ``known distribution'' is effectively
your observed sample, and you're resampling from it to generate simulated
datasets. So, while Monte Carlo simulation is more general, it can be
seen as a specific application of the bootstrap method when you use it
for simulating data based on known probability distributions.
2. Question: In a model with a single output and a single input variable, I know that the input conditional on the output is normal. Should I use logistic regression or discrimi- nant analysis?
Answer:
If you know that the input conditional on the output is normal (i.e.,
you are dealing with a regression problem), you should use linear
regression. Logistic regression and discriminant analysis are not
appropriate for this scenario.
a. Linear Regression: Linear regression is used when the relationship
between the dependent variable (output) and independent variable
(input) is assumed to be linear. If you have a single output and a
single input variable, and you know that the input conditional on
the output is normally distributed, linear regression is the most
suitable choice. It models the mean of the input variable as a
linear function of the output variable.
b. Logistic Regression: Logistic regression is used for binary
classification problems when the dependent variable is binary (two classes). It models the probability of an event occurring, and it's
not designed for modeling continuous input variables.
c. Discriminant Analysis: Discriminant analysis is used for
classification problems with multiple classes. It aims to find
discriminant functions that best separate the classes. It's not
appropriate for modeling a single continuous input variable.
In summary, if you know that the input conditional on the output is
normally distributed, use linear regression to model this relationship.
Find all the mistakes in chatGPT's output (if any exist at all), and justify thoroughly.
Exercise 4. (30 points) For this exercise, the only extra package allowed is ISLR2. The dataset Default will be used throughout the exercise and is accessible through the ISLR2 package. We will only look at the variables default and balance in this exercise.
1. Write the R code to reproduce the following figure
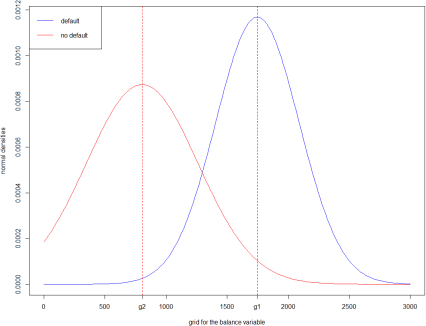
Figure 2. The distribution of the balance variable.
2. Using the same values for g1 and g2 as in the figure, and with obvious meanings for the variable names p1, s1 and s2, write your own R function that has the name ppr and that can be used for predictions in the following way: For example, when balance takes either one of the values 1800, 1500 or 1000, then the function syntax and output is
typing ppr(x=1800,p1,g1,g2,s1,s2) yields 0.329938
typing ppr(x=1500,p1,g1,g2,s1,s2) yields 0.1016933
typing ppr(x=1000,p1,g1,g2,s1,s2) yields 0.004558713
Explain thoroughly how the function ppr works and use it to compute the training error rate.
2023-09-12