ECE-GY 6013. Digital Communications Midterm Solutions, Spring 2019
Hello, dear friend, you can consult us at any time if you have any questions, add WeChat: daixieit
ECE-GY 6013. Digital Communications
Midterm solutions, spring 2019
1. Baseband equiualentflteT. consider a communication system with three steps:
. A complex baseband signal u(t) is upconverted up(t) = Re(u(t)e2πifct) at fc = 2.3 GHz.
. The signal up(t) is passed through a channel with magnitude response in Fig. 1to obtain gp(t).
. The received signal is downconverted, U (t) = 2gp(t)e-2πifct and g(t) = hLPF (t) * U (t) where hLPF (t) is an ideal low-pass ilter.
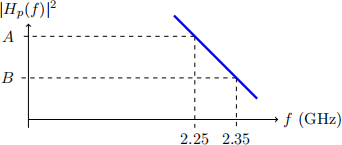
Figure 1: passband magnitude response in linear scale. Drawing not to scale.
(a) Draw the baseband equivalent channel magnitude response |H(f)| 2 = |y (f)| 2 /|u (f)| 2 . (b) suppose that A = 3(1o)-8 , B = (1o)-8 and the transmitted signal is u(t) = ce2πifot
with fo = 25 MHz. If the transmit power is 2o dBm, what is the received complex baseband power? Your answer will have a logarithm in it. You do not need to evaluate the logarithm.
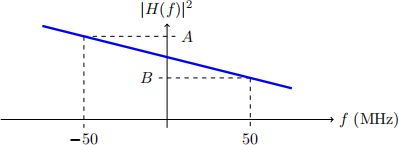
Figure 2: complex baseband magnitude response in linear scale. Drawing not to scale.
2. MeasuTing the poweT. Suppose that x is a MATLAB Vector of samples of a complex baseband signal ① (t) at a sampling rate 毛专ampMHz = 200 MHz. The commands,
fsampMHz = 200;
fsamp = fsampMHz *1e6;
nfft = 512;
[Px, fx] = pwelch(x,hamming(nfft),[],[],fsamp, ' cen大ered ' );
returns:
. fx: A Vector of nfft frequencies uniformly from -fsamp/2 to fsamp/2 in Hz.
. Px: A Vector where Px(i) is the estimate of the PSD of x in mw/Hz (in linear scale) at frequency fx(i) .
write a few lines of MATLAB code to do the following:
(a) Estimate the total power in dBm of ① (t).
(b) Find the ratio p0/p1 where p0 is the total power in the frequencies |f | 参 25 MHz and p1 is the total power in the frequencies f E [25, 75] MHz. The ratio should be expressed in dB.
3. TX flteTing. Suppose that a complex baseband signal s[n] has a discrete PSD as shown in Fig. 3. The sample rate is 2oo MHz. The signal bandwidth is |Ω| 三 o.8π .
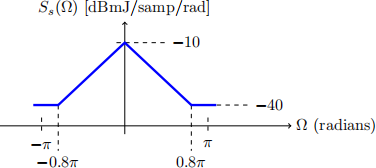
Figure 3: PSD of the discrete-time symbols s[n]. only the PSD in the range |Ω| 三 π is shown.
(a) The signal s[n] is upsampled by a factor of two with zero insertion to create ① [k]. Draw the discrete-time PSD of ① [k].
(b) The upsampled symbols ① [n] are then iltered to create

where 1/T = 4oo MHz, the sampling rate after up-sampling. Draw one possible ilter magnitude response |p (f)| 2 such that:
. |p (f)| 2 is lat in the main signal bandwidth.
. The peak PSD of Su(f) is -8o dBm/Hz.
. The peak PSD of Su(f) outside signal bandwidth is -12o dBm/Hz.
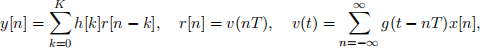
4. Efectiue discTete-time channel. Consider a digital transmission and reception performed in the following steps:
![]() u(t) =Σ s[n]pt从 (t - nT),
u(t) =Σ s[n]pt从 (t - nT),
g(t) = h chan(t) * u(t)
T [n] = v(nT), v(t) = prx(t) * g(t)
Suppose the sample rate is 1/T = 100 MHz, prx(t) = ptx(t) = ![]() Rect
Rect ![]() a frequency response shown in Fig. 5.
a frequency response shown in Fig. 5.
(a) write a mathematical equation for the efective discrete-time channel frequency response
H(Ω) = ![]() .
.
(b) Approximately draw |H(Ω)| .
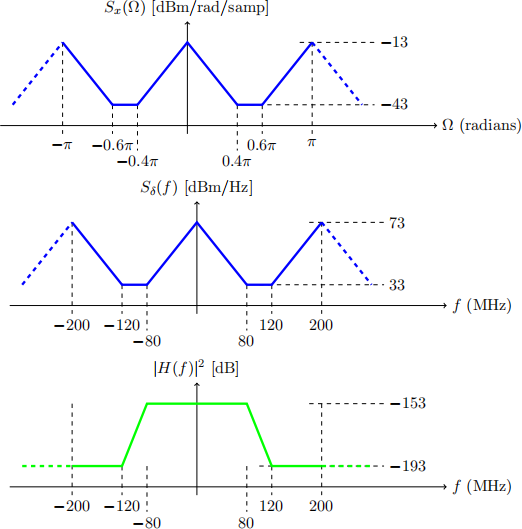
Figure 4: Top panel: PSD of the upsampled discrete-time symbols ① [k]. only the PSD in the range |Ω| < π is shown. Middle panel: PSD of the signal uδ(t) after an ideal ADC. Bottom panel: Filter speciication |H(f)| 2 .
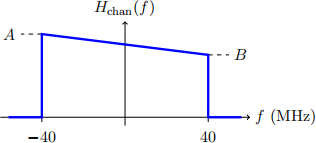
Figure 5: complex baseband channel response in linear scale. Drawing is not to scale.
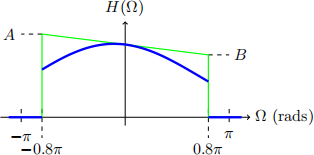
Figure 6: Green line: Hchan(Ω/(2πT). Blue line: Efective discrete-time channel response H(Ω). only the regions |Ω| 三 π is shown.
5. RX flteTing in MATLAB. suppose that transmit samples ① [n] and g[n] are related by,
for some continuous-time ilter g(t) and discrete-time ilter h[n]. Let

be the discrete-time channel frequency response between ① [n] and g[n]. write MATLAB code to compute the complex frequency response F (Ω) for 执p大试 = 128 points uniformly in Ω E [-π, π].
You may assume you have the following MATLAB objects:
. scalar T: The sampling period in seconds.
. vector h: vector of the ilter taps of h[n];
. Function G = Gresp(f) : A function that returns the complex frequency response G(f) at a vector of frequencies f. The input 毛 is in Hz.
. Function [H,W] = freqz(h,1,np大s) , a function that returns a vector H of complex fre- quency response at frequencies W of a discrete time ilter with taps h at np大s frequencies uniformly in Ω E [-π, π].
6. signal spaces. suppose that T 持 o is a ixed constant and 2 is a signal sets with signals of the form,
s(t) = (1 + a1 e2πit/T )(1 + a2 e2πi(2)t/T ), t E [o, T],
for a1 , a2 E C.
(a) (1o points) Find a basis with of a vector space with minimum dimension containing 2 .
That is, ind functions φ1 (t), . . . , φN (t) such that every signal s(t) E 结 can be written as

for some coe伍cients sj E C.
(b) (5 points) Suppose that (a1 , a2 ) = (2, 3 + 4i). what are the coe伍cients (s1 , . . . , sN ) in the basis in part (a)?
7. DegTees offTeedom. A wireless system transmits on a channel from 1.79 to 1.81 GHz. Due to overhead, the system can use up to 8o% of the degrees of freedom.
(a) (5 points) what are the number of (complex) degrees of freedom per second after ac- counting for overhead?
(b) (5 points) The received power spectral density is -1oo dBm/Hz. what is the energy per complex degree of freedom in dBmJ? Your answer will have a logarithm. You do not need to evaluate the logarithm.

2023-09-12