AI, Ethics, and Society Homework Project #2
Hello, dear friend, you can consult us at any time if you have any questions, add WeChat: daixieit
AI, Ethics, and Society
Homework Project #2
Readings:
● Chapter 4: Weapons of Math Destruction (Propaganda Machine: Online Advertising)
● Optional: Darrel Huff, Chapter 1: How to lie with statistics, Norton, New York, 1954 - [Internet Search – Huff + “How to lie with statistics” + pdf]
In this assignment, you’ll begin the process of exploring relationships in data. You’ll accomplish this task by computing some basic statistical measures on one of three datasets. This is a goodtime to learn or reboot your Python coding skills.
Step 1 - Select one of the datasets available on CANVAS for completion of this assignment:
● [mental-health-in-tech-survey-2019.csv] Mental Health in Tech Survey: Survey on Mental Health in the Tech Workplace in 2019 -https://osmhhelp.org/research.html
Dependent Variables:
o treatment: Have you ever sought treatment for a mental health disorder from a mental health professional? (FALSE/TRUE)
o mental_health_disclosure: Would you feel comfortable discussing a mental health issue with your direct supervisor(s)? (Yes/Maybe/No)
o mental_health_support: Overall, how well do you think the tech industry supports employees with mental health issues? (numerical: 1-5)
● [hospital-discharge-2017.csv] New York Hospital Inpatient Discharge Information in 2017:
https://health.data.ny.gov/dataset/Hospital-Inpatient-Discharges-SPARCS-De-Identified/22g3- z7e7
Dependent Variables:
o Length of Stay: a numeric value representing number of days between admission and discharge
o APR Severity of Illness Code: a numeric value representing severity of illness
● [deaths-in-custody.csv] Information on deaths that occur in custody or during the process of arrest in California -https://openjustice.doj.ca.gov/data
Dependent Variables:
o manner_of_death: Suicide/Natural/Accidental/Homicide/Cannot be Determined/Other (for all others)
o custody_status: Sentenced/Awaiting Booking/Booked – Awaiting Trial/ Booked – No Charges Filed/Other (for all others)
Step 2 - Explore the data by answering the following questions:
● Which dataset did you select?
● How many observations are in the dataset?
● How many variables in the dataset?
● Does this dataset seem to belong to a regulated domain in lawas discussed in the lectures? If yes, which one?
● How many variables in the dataset are associated with a legally recognized protected class? In a table format, list those variables associated with a protected class, identify the protected class and the
associated legal precedence/lawas discussed in the lectures.
Example Output (associated with a different dataset) -
Dataset: Housing Decisions in Metro-Atlanta
Number of Observations: 1,400
Number of Variables: 16
Regulated Domain in Law: Housing (Fair Housing Act)
Number of Protected Class Variables: 2
|
|
Protected Class |
Law |
|
nationality |
National origin |
Civil Rights Act of 1964, 1991 |
|
pregnant (y/n) |
Pregnancy |
Pregnancy Discrimination Act |
Step 3 - Determine the relationships between dependent and independent variables
The frequency of a value represents the number of times a value occurs in a data set. Compute the frequency of each value associated with each dependent variable (listed in Step 1) as a function of all of the protected class variables (independent variables) identified in Step 2. Create table(s) and histogram(s) comparing the frequency values of the dependent variable as a function of the independent variable.
Hint: For variables that are continuous, you might consider creating intervals that represent the data. For categorical/ordinal/nominal values, you might consider converting to numerical values based on a reasonable (albeit subjective) ordering. Don’t forget to do this for EACH dependent variable against all of the protected class variables.
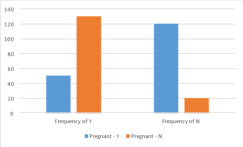
Example Output for One Dependent-Independent Variable Combination:
|
Independent Variable - Protected Class Variable |
Dependent Variable - Housing Decision (Y/N) |
|
Pregnant – Y |
Frequency of Y: 50 Frequency of N: 120 |
|
Pregnant – N |
Frequency of Y: 130 Frequency of N: 20 |
Step 4 - Show how to manipulate with data
Select one protected class variable (independent variable) and one dependent variable.
• Create a graph to support the “fairness” hypothesis (The system is fair. There is no difference in the outcomes.)
• Create a graph to support the bias hypothesis (The system is biased). There is a difference in the outcomes.
• For each, provide a brief description of your manipulations.
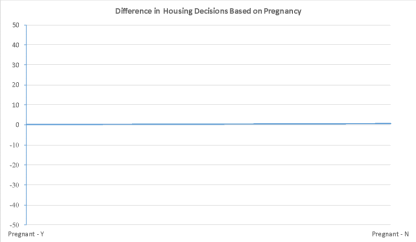
Example Output:
1) Fair Hypothesis: As seen from this graph, housing decisions are not dependent on the pregnancy status of women. [Manipulations: Used line graph; Increased Scale to +-50; Mapped the ratio of
positive Y decisions (i.e. 50/180 versus 130/180); No label on the Y-Axis].
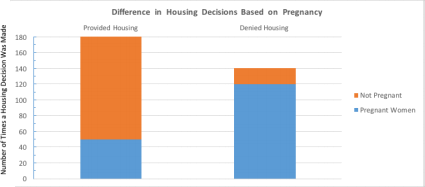
2) Bias Hypothesis: As seen from this graph, housing decisions are significantly dependent on the
pregnancy status of women. [This hypothesis was easily supported with the data so didn’t require much in manipulations: Used stacked bar graph; Reduced Scale; Reworded labels].
Step 5:
• Given your selected protected class variable (independent variable), calculate the average (using mean, median, and mode) of the protected class group (Hint: Variables might need to be converted to numerical values as needed).
• Run the random sampling method using 50% of the data to create a reduced dataset. Calculate the average (mean, median, and mode) of the protected class group. Indicate if there is a difference (or not) between the original dataset and the reduced dataset for any of the averages.
• Provide all results.
Example Output Illustrating Possible Average Computations:
|
Protected Class Variable (Pregnant) |
Mean |
Median |
Mode |
|
Original Data Set |
0 (NO) |
0 (NO) |
0 (NO) |
|
Reduced Data Set |
0 (NO) |
1 (YES) |
0 (NO) |
|
Difference |
No Difference |
Difference |
No Difference |
Step 6: Given your reduced dataset from Step 5,Repeat Step 3 (frequency and histogram) using your selected dependent variable as a function of your selected independent variable (from Step 4). Explain any differences (in at least 2 sentences). If you used the random sampling method, would members associated with the protected class variable benefit or be harmed? Explain your reasoning (in at least 2 sentences).
Step 7: Turn in a report (in PDF format) documenting your outputs in each Step. The report should follow the JDF format (see canvas for more instructions for JDF format). Jupyter notebook (ipynb files) submission is optional, but a final PDF document per JDF format is required. The filename for submission is GTuserName_Assignment_2, for example, Joyner03_Assignment2. Reports that are not neat and well organized will receive up to a 10-point deduction. All charts, graphs, and tables should be generated in Python or Excel, or any other suitable software application, else appropriate points will be deducted, which could be the maximum.
2023-09-05