Intermediate macro: assignment #1
Hello, dear friend, you can consult us at any time if you have any questions, add WeChat: daixieit
Assignment #1
The assignment is marked out of 25 points. The weight given to each part is indicated below.
Style requirements: please keep THREE decimal places in your answers and include your EXCEL results as an appendix in your assignment. Please also take care to structure your answers clearly. (1 point)
Question 1
A model of labor market. Some economists argue that the Beveridge curve in the U.S. has shifted out after the Global Financial Crisis (GFC) because the labor market in the U.S. has become less efficient. Your task is to understand how the U.S. labor market responds to the recession caused by the GFC. Suppose each period lasts a month. The parameter values are given in Table 1.
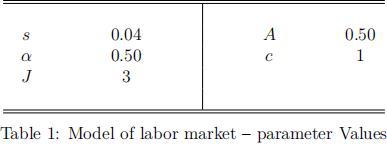
(1) Using the parameter values in Table 1, calculate the steady-state values of the market tightness, the unemployment rate and the vacancy rate. (2 points)
(2) Suppose the economy was initially in its steady state. At t = 1, a recession caused the value of filled jobs J to decrease to J = 2 for 15 months. Starting from the steady state, use the other parameter values as in Table 1 and a spreadsheet program to calculate and plot the time-paths of the market tightness, the unemployment rate and the vacancy rate for 15 months (t = 0, 1, ..., 15) after the economy was hit by the recession. Describe how the market tightness, the unemployment rate and the vacancy rate respond to the decrease in J. Has the economy converged to a new steady state? Explain your findings. (3 points)
(3) Suppose the economy was initially in its steady state. At t = 1, a recession caused the matching efficiency parameter A to decrease to A = 0.3 for 15 months. Starting from the steady state, use the other parameter values as in Table 1 and a spreadsheet program to calculate and plot the time-paths of the market tightness, the unemployment rate and the vacancy rate for 15 months (t = 0, 1, ..., 15) after the economy was hit by the recession. Describe how the market tightness, the unemployment rate and the vacancy rate respond to the decrease in A. Has the economy converged to a new steady state? Explain your findings. (3 points)
Question 2
Dynamic AS-AD model. The recent fall in consumer confidence and business confidence have made the demand for Australian goods decrease for several years. Your task is to understand how this adverse aggregate demand shock affects the Australian economy and the use of monetary policy in stabilising the economy.
For simplicity, suppose the natural level of output is constant. Each period lasts a year. Interest rates and inflation are expressed in percentage points. The parameter values are given in Table 2.
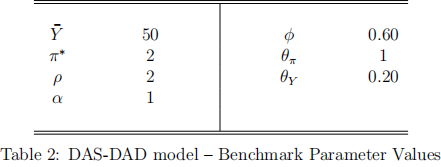
(1) Using the parameter values in Table 2, calculate the medium-run equilibrium values of inflation, output and the nominal and real interest rates. (1 point)
(2) Suppose the economy was initially in its medium run equilibrium. At year t = 1 the economy was hit by a persistent adverse aggregate demand shock ε < 0 that lasts for four years and then reverts to zero. In particular, the adverse aggregate demand shock takes the value εt = −2 for four years (t = 1, 2, 3, 4) before reverting to zero at t = 5. Starting in the medium-run equilibrium, use the parameter values in Table 2 to calculate the magnitudes of the impact effects at t = 1 on inflation, output, nominal and real interest rates. Also explain how you can recover the values of inflation, output, nominal and real interest rates from t = 2 onwards. (3 points)
(3) Now use a spreadsheet program to calculate and plot the time-paths of inflation, output, nominal and real interest rates for 50 years after the initial demand shock (t = 0, 1, ... , 50). Describe the inflation, output, nominal and real interest rates dynamics associated with this adverse aggregate demand shock. Explain how monetary policy responds to these inflation and output gaps. (3 points).
(4) Suppose the RBA decides to respond more aggressively to output gap by setting θπ = 0.2 and θY = 1. Keeping all other parameters as in Table 2, recompute the time paths of output, inflation, nominal and real interest rates for 50 years after the initial demand shock (t = 0, 1, ... , 50). Explain how the policy change affects the time paths of inflation, output, nominal and real interest rates. Is there a policy tradeoff between inflation and output? Explain. (3 points)
(5) Suppose that people’s expectations of inflation are subject to random shocks. That is, instead of being merely adaptive, expected inflation in period t, as seen in period t − 1, is Et−1(πt) = πt−1 + ηt−1, where ηt−1 is a random shock. This shock is normally zero, but it deviates from zero when some event beyond past inflation causes expected inflation to change. Similarly, Et(πt+1) = πt + ηt. Derive both the DAD equation and the DAS equation in this slightly more general model. (3 points)
(6) Following part (5), suppose that the economy experiences an inflation scare. That is, at year t = 1, for some reason, people come to believe that inflation in year t = 1 is going to be higher, so η1 = 1 for this year only. Starting in the medium-run equilibrium, use the parameter values in Table 2 and the new DAD and DAS equations to compute and plot the time paths of inflation, output, nominal and real interest rates for 50 years after the inflation expectation shock hits the economy (assuming no other shocks). In what sense are inflation scares self-fulling? Explain. (3 points)
Deadline and format
This assignment represents 10% of the available credit in ECOS2902 Intermediate Macroeconomics Honours. The assignment is due by 11:59pm on Friday October 15th. Your assignment should not exceed 1500 words in length. You should use relevant diagrams and/or algebra to reinforce your argument where appropriate. Citations, labels in diagrams, symbols in equations and numbers in tables will not count towards the word limit.
The is an individual assignment. All assignments will be electronically screened for plagiarism.
Assignments must be submitted in electronic format by 11:59pm on the due date. All worked answers should be typed and submitted as PDF files. This includes all mathematical equations. The only exception is graphs, which you can draw by hand, scan them and include them as figures in the PDF. Any untyped assignment will not be marked and will be returned to students for re-submission that incurs a late submission penalty. Moreover:
● You must keep a copy of your assignment.
● Plagiarism or other forms of academic dishonesty will result in discipline proceedings being brought against you.
● 5% of the mark will be deducted for each calendar day delay after the due date for up to 10 calendar days.
2021-09-06