ESS 17 Summer 2023 HW#2: Exploring Climate Change with Temperature Datasets
Hello, dear friend, you can consult us at any time if you have any questions, add WeChat: daixieit
ESS 17 Summer 2023
HW#2: Exploring Climate Change with Temperature Datasets
DUE August 29, 2023
Introduction
As you know, the temperature of the planet varies spatially and with time. To determine the long-term trends in global temperature, it is important to understand the variability across time and space. In this case, long-term is defined as the period that instrumental temperature data exist, or about the last 150 years. This analysis requires some sophisticated geospatial statistics, which we will NOT be doing in this class.
Tutorial Videos:
· Excel: Transposing, Temperature Anomalies, Moving (Running) Means
In this homework, you will:
· Explore interannual temperature changes (temperature, anomalies, and moving averages)
· Discuss how short-term data, like temperature, is appropriately used to understand climate change
The Excel file provided on Canvas contains monthly average temperature data for Maine and Puerto Rico over many years. The worksheet tab labeled “raw data” represents the data as they are downloaded from the data center website. Clearly, this is a difficult file to work from it its current form. It is big! Thus, it is useful to work with subsets of data.
*A RANDOM TIP IN LIFE: Never alter the “raw data” file – ever! Instead, to work with a subset of the data, make a copy of the raw data file and alter the copy. This way, if you ever make a mistake, you can always go back to the original raw data file*
Directions: Use the Excel file from “ESS15_HW1_MainePuertoRicoTempData.xlsx” to work on this lab. Watch the tutorial videos above to help guide you in this data analysis.
1. Make a graph of month versus monthly temperature from 2015 to 2019 for data from Maine. All five years should be plotted on the same graph. Copy & paste your graph here (as an image). Be sure to:
a. include a useful title
b. include x- and y-axes labels with units,
c. scale the x and y axis range to be appropriate for the data
d. include a legend. (5 pts)
2. Make a graph of month versus monthly temperature from 2015 to 2019 for data from Puerto Rico. All five years should be plotted on the same graph. Copy & paste your graph here (as an image). Be sure to:
a. include a useful title
b. include x- and y-axes labels with units,
c. scale the x and y axis range to be appropriate for the data
d. include a legend. (5 pts)
3. Describe the overall trends you see for both the Maine and Puerto Rico data. For example, do low/high temperatures correspond to certain months? What are the low/high temperature values? What is the range in temperature? Are there similarities or differences? (3 pts)
4. Comment on the similarities and differences you observe between the sites and provide a scientific explanation for any similarities or differences you see. (3 pts)
5. Calculate the average annual temperature for the Maine dataset from 1895-2019. Please note that there is annual data for 2020 and 2021, but we will return to this data at a later step.
Make a plot of year versus average annual temperature for Maine.
First, move the appropriate data into the separate tab called “AnnualTemp_ME”. To move the averages, copy and right click to paste, and choose “paste special”, then “values”, and “transpose”. Copy & paste your graph below. Be sure to:
a. include a useful title
b. include x- and y-axes labels with units,
c. scale the x and y axis range to be appropriate for the data (5 pts)
6. Describe the overall trends you see through time. Is average annual temperature increasing, decreasing, or staying the same? Are there any obvious peaks (maximums) or minimums in annual temperature? (3 pts)
7. Calculate the average annual temperature for the Puerto Rico dataset from 1956-2019.
8. First, move the appropriate data into the separate tab called “AnnualTemp_PR”. To move the averages, copy and right click to paste, and choose “paste special”, then “values”, and “transpose”. Copy & paste your graph below. Be sure to:
a. include a useful title
b. include x- and y-axes labels with units,
c. scale the x and y axis range to be appropriate for the data (5 pts)
9. Describe the overall trends you see through time. Is average annual temperature increasing, decreasing, or staying the same? Are there any obvious peaks (maximums) or minimums in annual temperature? (3 pts)
10. Using the 1961 to 1990 period as the baseline, calculate the temperature anomaly for each year’s average annual temperature for both Maine and Puerto Rico. (4 pts)
Plot the temperature anomaly for all years for each site on the same plot (i.e., two unique lines). Paste your graph below. Be sure to:
a. include a useful title
b. include x- and y-axes labels with units,
c. scale the x and y axis range to be appropriate for the data
d. include a legend (4 pts)
11. Describe the overall trends you see through time. Is annual temperature anomaly increasing, decreasing, or staying the same as we move forward in time? Are there any obvious peaks (maximums) or minimums in the annual anomaly? Do both sites (ME and PR) show the same trends? Or are there differences? Discuss. (5 pts)
12. Calculate a 5-year moving average for the Maine temperature anomaly dataset. (3 pts)
Plot the 5-year moving average temperature anomaly with the annual Maine temperature anomaly dataset. Paste your graph below. Be sure to:
a. include a useful title
b. include x- and y-axes labels with units,
c. scale the x and y axis range to be appropriate for the data (4 pts)
13. Describe the overall trend(s) you observe in the 5-year moving average of the Maine annual temperature anomaly through time. What is the observed temperature anomaly in Maine over the past few years? How does this compare to the global average temperature anomaly in 2020 of 1.02°C (1.6°F)? (3 pts)
14. Calculate a 5-year moving average for the Puerto Rico temperature anomaly dataset. (3 pts)
Plot the 5-year moving average temperature anomaly with the annual Puerto Rico temperature anomaly dataset. Paste your graph below. Be sure to:
a. include a useful title
b. include x- and y-axes labels with units,
c. scale the x and y axis range to be appropriate for the data (4 pts)
15. Describe the overall trend(s) you observe in the 5-year moving average of the Puerto Rico annual temperature anomaly through time. What is the observed temperature anomaly in Maine over the past few years? How does this compare to the global average temperature anomaly in 2020 of 1.02°C (1.6°F)? (3 pts)
16. Describe any similarities and differences you observe between the temperature anomalies from Maine and Puerto Rico. Should it be expected that these two locations should experience the same temperature change? Why or why not? (5 pts)
|
|
|
This color-coded map in Robinson projection displays the 5 year global temperature anomalies from 2017-2021. Normal temperatures are shown in white. Higher than normal temperatures are shown in red and lower than normal temperatures are shown in blue. Normal temperatures are calculated over the 30 year baseline period 1951-1980. Scale in degrees Fahrenheit. Figure from the NASA Scientific Visualization Studio. |
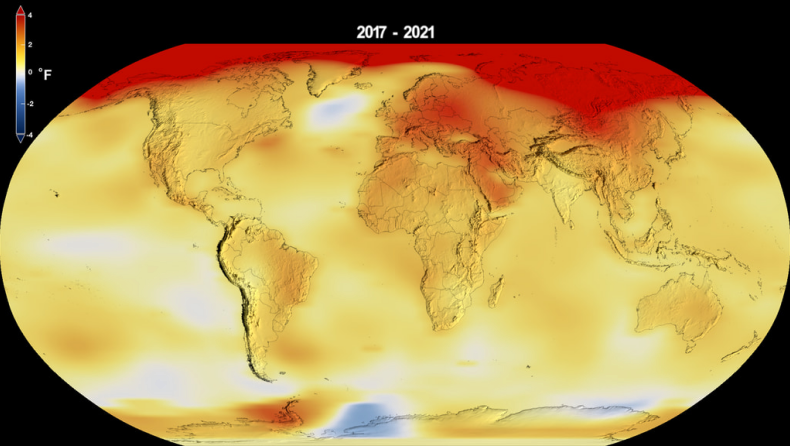
17. The image above shows the global temperature anomalies from 2017-2021 compared to the baseline period of 1951-1980. What are some observations you see about the global temperature changes? Are all places on Earth warming at the same rate? Are there any places that have seen cooling? Why might there be this heterogeneity in global temperature changes? (3 pts)
18. Imagine a climate change denier argues: “Climate change is not happening because it is cooling near Antarctica”. Write a rebuttal to this argument using the information you’ve learned in this homework exercise. It may be helpful to check out Skeptical Science’s write ups about this topic found here. (3 pts)
SUMMARY (Freebie)
In one paragraph, reflect on what you learned from this homework exercise. How did this homework exercise connect with the material you have learned in class? Is there anything you struggled with and would like more explanation of?
2023-09-01