ETF2020 Statistical Foundations of Business Analytics Assignment 1
Hello, dear friend, you can consult us at any time if you have any questions, add WeChat: daixieit
ETF2020 Statistical Foundations of Business Analytics
Assignment 1 — Global Mean Sea Level
Important notes:
1. This is an individual assignment. This assignment is worth 20% of this unit’s total mark. Marks will be deducted for late submission on the following basis: 20% for each day late, up to a maximum of 3 days. Assignments more than 3 days late will not be marked.
2. Submission deadline is 11:55pm, Friday, 1/Sep/2023. Please submit a soft copy and your R script through Moodle. Name the soft copy as follows: student ID Name.pdf![]() (or .doc). Pdf file is preferred, but word file is also fine. Name the R script in the same fashion. Also, on the title page, please make sure you provide the student ID and name correctly.
(or .doc). Pdf file is preferred, but word file is also fine. Name the R script in the same fashion. Also, on the title page, please make sure you provide the student ID and name correctly.
3. Please add sufficient description to your code, so the markers can read the code easily. Penalty may occur without doing so. Notations used in the assignment need to be typed correctly and properly. Incorrect notations will be treated as wrong answers.
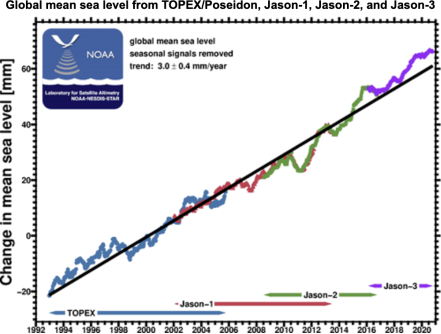
In the case study, we investigate the global mean sea level. The interpretation of the dataset to be studied can be found HERE. The following figure is copied from the website of NOAA. We aim to provide more details for the global mean sea level using what we have covered so far. Specifically, we consider the dataset “GMSL cleaned.csv” which is available at Moodle![]() . Note that each row of the dataset represents one observation. Keep TWO decimals wherever necessary.
. Note that each row of the dataset represents one observation. Keep TWO decimals wherever necessary.

Questions:
1. (a) How many years are covered in the dataset? [1 points]
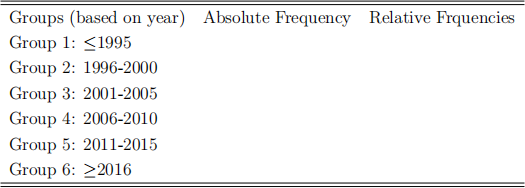
(b) Report the Absolute Frequency and Relative Frequencies in the following table. [3 points]

2. What are the minimum value and maximum value of each group? Report them in a table. What is the the minimum value and maximum value of the entire dataset? [4 points]
3. Find the minimum value of each group. Using these minimum values, consider five prob- abilities (0, 0.25, 0.5, 0.75, 1), and generate the corresponding quantiles. Report these quan- tiles in a table, and then plot the empirical distribution function using these quantiles. [4 points]
4. Now, we have three students: A, B and C. Based on the groups of Q1, each of them wants to randomly pick the data from a group to look into. More than one person studying the data of the same group is allowed. How many possible outcomes can we have? Write down the result, and verify our calculation with the corresponding R code. [4 points]
5. Again, we have three students: A, B and C. Based on the groups of Q1, each of them wants to randomly pick the data from a group to look into. They have to study three different groups. How many possible outcomes can we have? Write down the result, and verify our calculation with the corresponding R code. [4 points]
Hints:
1. Note that there are missing values in the csv file.
2. “round()” and “floor()” might be useful when formatting decimal places.
2023-08-26
Global Mean Sea Level