ELEC 202 COMMUNICATION SYSTEMS SECOND SEMESTER EXAMINATION 2020/21
Hello, dear friend, you can consult us at any time if you have any questions, add WeChat: daixieit
ELEC 202
SECOND SEMESTER EXAMINATION
REPLACEMENTS 2020/21
COMMUNICATION SYSTEMS
1. a) A carrier signal of frequency f! is frequency-modulated by a single-tone message signal of frequency fm such that the largest frequency deviation is Δf. Estimate the bandpass bandwidth. The values of fm , f! and Δf are as provided in the table on page 3. 5
b) The amplitude of the message is increased by a factor of p while its frequency is lowered by a factor of q. Estimate the bandwidth of the new modulated signal. The values of p and q are as provided in the table on page 3. 5
c) Draw the block diagram of a zero-crossing FM detector, and discuss whether this could be used to recover the baseband message from a DSB-SC signal. Use appropriate diagrams, signal sketches and mathematical steps to support and illustrate your answer. 5
d) Consider the following scenario:
You need to transmit a large amount of plain text documents from one very old computer to another, but there is no way to connect the two computers. Neither computer has any wired or wireless connectivity options. Each computer has an integrated keyboard, monitor, speaker and microphone, but no serial or parallel ports and no removable storage. You can write and execute software on the computers, but you cannot open or alter the hardware in any way.
You have access to an FM transmitter and receiver, and you have at your disposal all the equipment and components in the Department’s undergraduate laboratories.
Describe how you would go about achieving this task, including illustrations and calculations in your design as appropriate. 10
Total
25
2. a) A carrier signal of frequency f! is frequency-modulated by a message signal of bandwidth fm such that the largest frequency deviation is Δf. Determine whether this is narrow-band FM (NBFM) or wide-band FM (WBFM) and estimate the bandpass bandwidth. 5
The values of fm, f! and Δf are as provided in the table on page 3.
b) Show that the NBFM expression for a single tone message can be written as a scaled version of
cos wct − β sin wct ⋅ sin wmt
Sketch the above signal in the time and frequency domains, and comment on the bandpass bandwidth. 5
c) Draw the block diagram of a coherent DSB detector and discuss whether this could be used to recover the baseband message from a NBFM signal. Use appropriate diagrams, signal sketches and mathematical steps to support and illustrate your answer. 5
d) Consider the following scenario:
You need to transmit a large image data from one very old computer to another, but there is no way to connect the two computers. Neither computer has any wired or wireless
connectivity options. Each computer has an integrated keyboard, monitor, speaker and microphone, but no serial or parallel ports and no removable storage. You can write and execute software on the computers, but you cannot open or alter the hardware in any way.
You have access to an AM radio transmitter and receiver, and you have at your disposal all the equipment and components in the Department’s undergraduate laboratories.
Describe how you would go about achieving this task, including illustrations and calculations in your design as appropriate. 10
Total
25
3. a) Figure Q4 shows how the bit error rate (BER) of selected digital transmission systems is related to the signal-to-noise ratio (Eb/No). 5
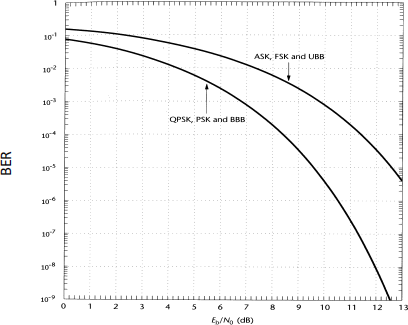
Figure Q3 – Bit error rate of selected digital transmission systems. BBB = bipolar baseband; UBB = unipolar baseband
Discuss what the information contained within Figure Q3 means, using communication principles to explain the shape of the curves and their relative positions. Comment on the effects of doubling the signal power on the BER for the different modulation formats.
b) During the current pandemic, with the increased pressure on the communications networks, we are often advised not to use the microwave (oven) when making video calls, watching HD videos, or doing something important online. Explain whether this advice has any scientific justification, referring in your answer to three different connection types: wired ethernet, Wi-Fi and cellular (mobile) 4G. 5
c) Explain what factors govern the maximum rate at which data can be communicated error- free across a channel and discuss some of the implications of this, using sketches and diagrams to help illustrate your point where relevant, stating any assumptions made, theorems used and parameters referred to. 5
d) Explain what is meant by quantization noise, illustrating your answer using a sinusoid quantised using a 2 bit ADC (analogue to digital converter) sampling at ‘ times the Nyquist rate (where ‘ is provided in the table on page 3). 5
e) Discuss how and why the bit error rate of M-ary ASK varies with M, explaining your reasoning, and using suitable illustrations as appropriate. 5
Total
25
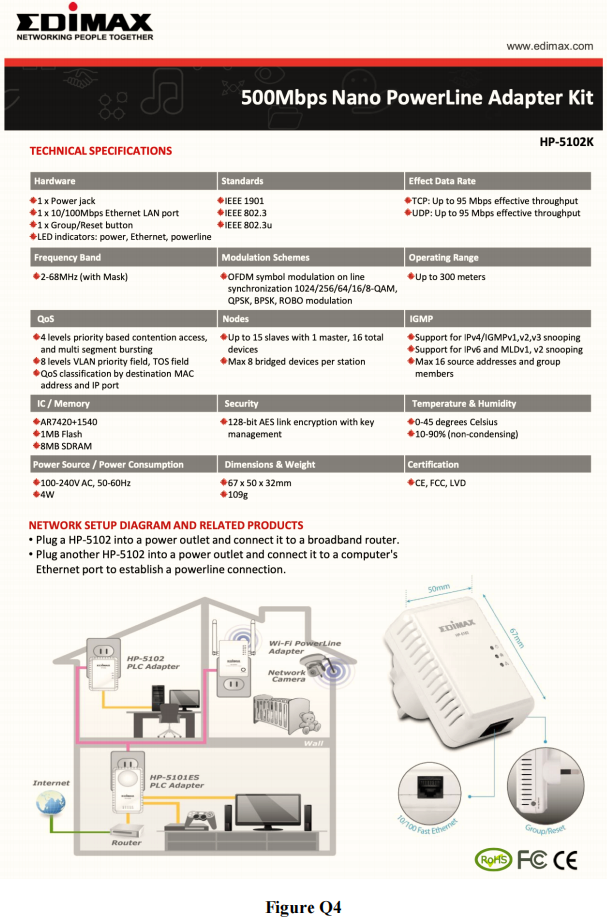
4. a) Power-line communications is a communication technology that enables sending data over existing domestic electric wiring systems using a modulated carrier. The data presented in the data sheet in Figure Q4 (on the following page) summarises some of the technical specifications of one such system.
i) Although the system is marketed as supporting data rates of up to 500 Mbps, most users only manage to achieve rates of around 50 Mbps internally within their homes. Explain why this might be the case? 2
ii) Even with data rates of 50 Mbps within the home, users often find internet download speeds are in the order of 10 Mbps. Explain what could be causing this discrepancy. 3
iii) The data sheet mentions modulation formats QAM, QPSK and BPSK. Briefly discuss the similarities and differences between these modulation formats, using illustrations as appropriate. How can these modulation formats be used on the same medium that delivers the domestic AC power? 5
b) Define the dynamic range of a quantizer, and show that this depends on the number of bits n used to encode each sample, as follows: 10
Dynamic range (dB) ≈ 6 ⋅ n
c) Explain the concept of companding and discuss how and why it is used to increase the signal to (quantization) noise ratio of a digital audio signal without increasing the data rate. 5
Total
25
5. A spectrum analyser is used to display a bandpass signal as shown in Figure Q5 below, where the horizontal axis is frequency and the vertical axis is 20log10 E , where E is the magnitude of the signal spectrum at any given frequency.

a) Explain why a logarithmic scale is often used in such displays. 5
b) Given that the modulation index can be expressed as a ratio of the (linear) amplitudes of the sideband and carrier peaks ESB and EC as follows: 5

show that the modulation index m can be found from the instrument display by
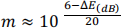
c) Using the value of ΔE(dB) provided in the table on page 3, estimate what percentage of the signal’s total power is contained within the upper sideband. 5
d) Is this signal over-modulated, under-modulated or perfectly-modulated? Explain your answer 5
e) What does the peak labelled X represent? Explain where this may have originated from and what affect it may have, if any, on the recovered signal. 5
Total
25
6. Examine the spectrum analyser screenshot depicted in Figure Q6 below, where both axes are linearly scaled.
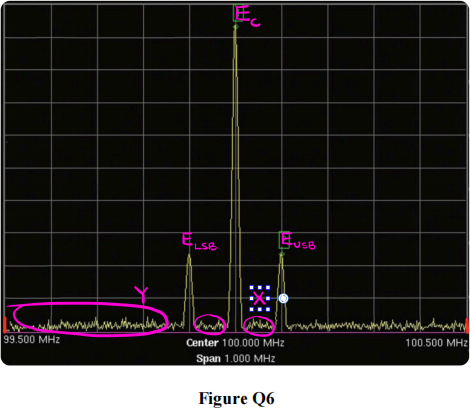
a) Name the modulation format, and describe the regions of the spectrum highlighted and
labelled X and Y. Discuss where these may have originated and how, if at all, they might affect the recovered signal. 5
b) Find the carrier frequency and bandpass and baseband message bandwidths. 5
c) Starting from the mathematical representation of this modulation format, show that the modulation index can be expressed as 5

d) Using the values of ![]() LSB ,
LSB , ![]() USB and
USB and ![]() C provided in the table on page 3, find the percentage of the bandpass signal power contained in the lower sideband. 5
C provided in the table on page 3, find the percentage of the bandpass signal power contained in the lower sideband. 5
e) Is this signal over-modulated, under-modulated or perfectly-modulated? Explain your answer. 5
Total
25
7. a) A low-cost weather balloon is to be released into the lower atmosphere equipped with the following sensors: camera, temperature, air pressure, humidity and GPS location. Live colour pictures are captured at a rate of 10 per hour, and the remaining measurements are taken every minute, and transmitted back to receiving stations on the ground. The on-board processor has no storage, so the data are transmitted at the rate at which they are acquired. 10
Design a suitable end-to-end simplex communication system for the above weather balloon, providing as much technical information as possible, showing your calculations and supported by relevant illustrations and sketches, with any pertinent assumptions stated explicitly.
b) The advert in Figure Q7 below appeared in a US newspaper in 1953. 10
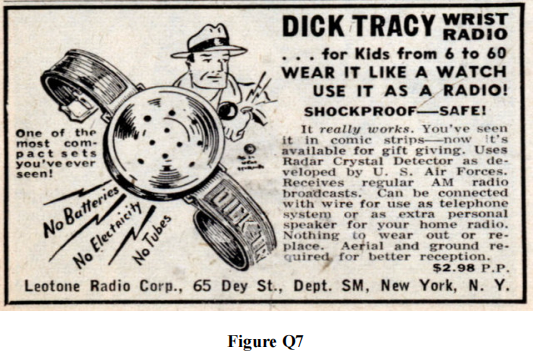
Using your knowledge of communications, explain how such a wearable radio could have worked, in as much technical detail as possible. Address issues such as how it could function without batteries, the range of signal frequencies, suitable antenna dimensions, whether it could be used for duplex operation, some of its limitations and whether or not it would work if used today.
c) Discuss the differences between coherent and non-coherent detectors for amplitude modulated signals, using diagrams, sketches and mathematical expressions to support your answer. 5
Total
25
![]() 8. a) You are tasked with helping a marine biologist design a remote observation system to collect,
8. a) You are tasked with helping a marine biologist design a remote observation system to collect,
transmit, receive and record the vocalizations of deep underwater marine life using an analogue hydrophone (underwater transducer) and a floating buoy to transmit the data to a shore-based logging station.
Dolphin vocalizations range in frequency from 0.2 to 150 kHz, and whale vocalizations range from 20 to 8000 Hz.
The floating transmitter can be set up to transmit using any common analogue or digital modulation format, but the available radio license limits the broadcast to the frequency range between 239.8 and 240.2 MHz, and the hydrophones and digitiser units must be chosen from those below. 15
Available hydrophone models:
|
Model |
Frequency range (kHz) |
Max operating depth (m) |
Omnidirectional |
Price (£) |
|
H1 |
0.02 to 178 |
600 |
Yes |
120 |
|
H2 |
0.02 to 80 |
500 |
Yes |
200 |
|
H3 |
0.2 to 320 |
800 |
No |
80 |
Available ADC boxes:
|
Model Max clock (kHz) Bits SNR (dB) Waterproof |
||||
|
ADC1 |
0.02 to 178 |
16 |
65 |
Yes |
|
ADC2 |
0.02 to 80 |
24 |
55 |
Yes |
|
ADC3 |
0.2 to 320 |
32 |
45 |
No |
Design a suitable communication system for the above application (from transducer to data logger), using the constraints given. Include as much detail as possible, including a block diagram, signal plots, details of all relevant parameters (such as antenna size, modulation format etc) with a justification for how they were selected. Do not exceed a single page.
b) The Internet backbone refers to one of the principal data routes between large, strategically interconnected networks and core routers on the Internet. It is a very high-speed data transmission line (typically a fiber optic trunk line) that provides networking facilities to Internet service providers all around the world.
Using your knowledge of communications, explain why the Internet backbone consists of cables rather than wireless connections, even though wireless signal propagation is considerably faster. Use relevant theorems and communication principles to support your answer. 10
Total
25
2023-08-23