Econ 522 Macroeconomics: Problem Set 1
Hello, dear friend, you can consult us at any time if you have any questions, add WeChat: daixieit
Econ 522 Macroeconomics: Problem Set 1
1 Calculating GDP
1. A cocoa farmer in Country X exports $500 worth of his cocoa beans to a chocolate manufac-turer in Country Y. The chocolate manufacturer keeps $300 worth of the cocoa beans in in-ventory for future production use. The chocolate manufacturer then refines the remaining beans and sells the refined cocoa beans to a chocolate company for $700. The chocolate com-pany makes the beans into chocolate and sells that to households for $1000. If the economy in country Y only consumes chocolate, calculate the GDP of country Y using the production and expenditure approach.
2 Nominal and Real GDP
Consider the following economy where only pizzas and soda are produced. Production and prices in year 1 and year 2 are given in the following table
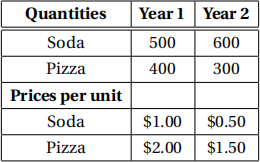
1. Compute nominal GDP in each year. What is the growth rate of nominal GDP?
2. Compute real GDP and real GDP growth rate using Year 1 as a base year. Repeat this exercise using Year 2 as the base year. Why does your answer depend on which base year you use?
3. Compute real GDP growth rate using the chain-weighted method. How is your answer com-pared to the two growth rates from part 2?
3 Using Logarithms
When calculating GDP growth rates, economists like to use the difference in the natural logarithm of GDP as an approximation for an economy’s growth. In this question, we will examine the usefulness of describing economic variables in terms of its natural log.
Some background info: As a review, let’s recall what happens with compound interest rates. Sup-pose you invest  for one year at interest rate
  At the end of the year, you get
 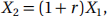 i.e.
i.e. 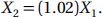 Interest can be compounded, for example, you might get a return every quarter. Suppose the annual interest rate is still
  then compounded quarterly, your final return at the end of the year is
  As the frequency of compounding becomes high, the formula (1 + r4 )4
converges to :
As the frequency of compounding becomes high, the formula (1 + r4 )4
converges to :
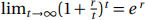
This implies that if your money gets compounded continuously, at the end of the year you would have  To get back the interest rate or growth rate of your investment, we can do a very simple transformation of the above equation by taking the natural logarithm on both sides
We can now do a very simple subtraction of two log variables to get out the growth rate!
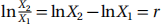
1. Download data on Annual Real GDP for the US economy from FRED (see instructions below) for the period covering 1976-2014. Calculate the growth rate of Annual Real GDP for each year by using the formula:
Find the average growth rate across all years.
2. Now calculate the annual growth rate for each year as:
Again find the average growth rate across all years.
3. Is there a large discrepancy between your answer in part 1.1 and part 1.2? Plot the two calcu-lated growth rate series,
and
. Calculate the correlation between the growth rate
Guide for Problem 3
All the data you will need for this question can be found at: http://research.stlouisfed.org/fred2/categories. You will need to register to access the data.
● Use the following data series: For GDP, use GDPCA (Home > Economic Data - FRED > Cate-gories > National Accounts > National Income and Product Accounts > GDP/GNP > Billions of Chained 2012 Dollars, Annual, Not Seasonally Adjusted
● Using Excel to organize the data into a single sheet (in the same file).
4 HP filter
For this question you are asked to compute the HP filter decomposition of GDP. You are asked to solve the minimization problem directly with using built-in functions in Excel. Refer to the guide at the end of this problem set for a step-by-step guide. Some additional notes:
1. Use quarterly data from 2000 to 2018 included.
2. Use the variable: Real Gross Domestic Product [GDPC1] as your GDP data. You can find this variable in FRED http://research.stlouisfed.org/fred2/.
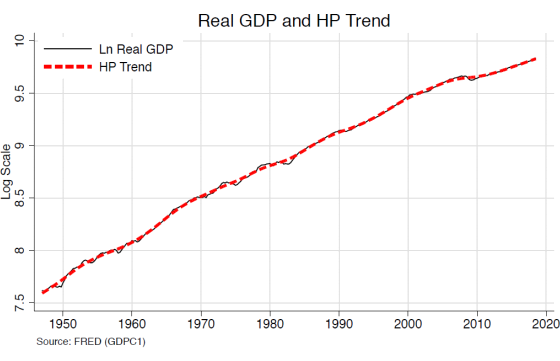
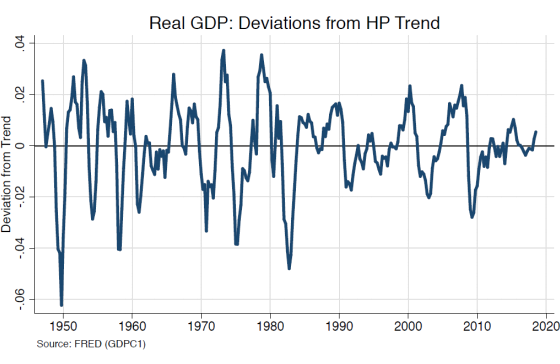
3. Include two graphs: (1) one for the trend together with the original data; (2) the second one reserve it for the cycle like below.
Guide for Problem 4
1. On the FRED website, you can access the time series of interest by using the search box. So simply type GDPC1 for GDP data and so on. Make sure these variables are quarterly. You can check and modify this by clicking the “edit graph”. You can download these data series by clicking “Download”.
2. Once you have the time series in Excel it’s time to apply the HP filter. Below is a simple way to do it with the tools available in Excel.
First, we construct the objective function. As a reminder, if we let
be the original series, the HP trend
is the
which solves the following problem:
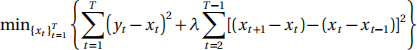
where λ is the smoothing parameter.
(a) In a blank Excel sheet, put the dates in column A and the data in column B.
(b) Construct the log of the series in column C. This corresponds to
(c) Construct the HP trend for the series, which corresponds to the
Follow these steps:
i. Make an initial guess for
Put this in column D.
ii. Create the series
and put this in column E.
iii. Create the series
and put this in column F.
iv. Set λ = 1600 (This is a standard value when using quarterly data). Put this in column G, row 1.
v. In column H, compute the value of the objective function in equation (4.1) given our initial guess and the previous steps.
vi. Now apply the Solver Excel-tool to find the HP trend
You should minimize the value of the objective function in part V by changing the values of
You now have the HP filtered data! To get the cyclical component calculate
for each
.
2021-09-01