STATS 769 Advanced Data Science Practice SEMESTER 2, 2020
Hello, dear friend, you can consult us at any time if you have any questions, add WeChat: daixieit
STATS 769
TEtM TEST - SEMESTEt 2, 2020
STATISTICS
Advanced Data Science practice
1. [10 marks]
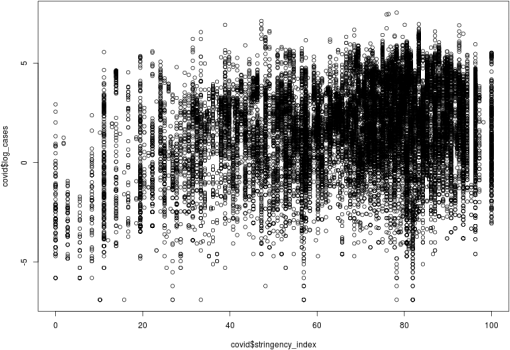
This question relates to a data frame covid that contains three variables, strin- gency-index, new-cases-per-million, and log-cases.
This data set is similar to, but NOT exactly the same as one of the data sets used in the course lab work.
> dim(covid)
[1] 21366 3
> head(covid)
stringency-index new-cases-per-million log-cases
|
ABW.1 |
0.00 |
18.733 |
2.930287 |
|
ABW.3 |
33.33 |
18.733 |
2.930287 |
|
ABW.7 |
44.44 |
74.930 |
4.316554 |
|
ABW.8 |
44.44 |
46.831 |
3.846545 |
|
ABW.9 |
44.44 |
18.733 |
2.930287 |
|
ABW.10 |
44.44 |
84.296 |
4.434334 |
The plot below shows the relationship between stringency-index and log-cases.
The following code is attempting to use a “validation-set” approach to calculate a test error estimate for a linear regression model (to describe the relationship between stringency-index and log-cases).
> N <- nrow(covid)
> train <- samp1e(seq(N), N*.8)
> yTrain <- covid$1og-cases[train]
> xTrain <- covid$stringency-index[train]
> yTest <- covid$1og-cases[-train]
> xTest <- covid$stringency-index[-train]
> fit <- 1m(1og-cases ~ stringency-index, covid)
> LogLoss <- function(p, y) {
+ -mean(y*1og(p) + (1 - y)*1og(1 - p), na.rm=TRUE)
+ }
> pred <- predict(fit, data.frame(stringency-index=xTrain)) > LogLoss(pred, yTrain)
(a) There are several errors in the above code. Identify the errors and write new code to ix the errors. [10 marks]
2. [15 marks]
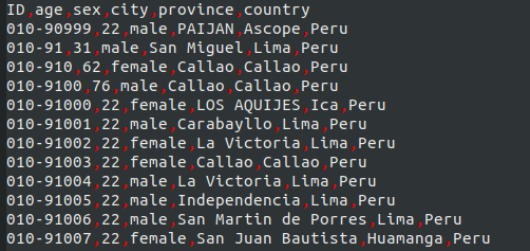
This question relates to a Csv ile "Covid. Csv".
This ile is similar to, but NOT exactly the same as the iles used in the course lab work.
There are several thousand lines in the Csv ile, but the irst few lines are shown below.
(a) Explain in detail what the following shell code is doing and what the result- ing output would look like.
You will not be able to give exact details of the output, but you should be able to describe its general structure.
awk -F, -e INR > 1 { print($2) } ' Covid. Csv > ages
RsCript -e Itable(read. table("ages")[[1]])' [10 marks]
(b) write a SINGLE bash expression (that may contain multiple commands piped together) that prints out the total number of 52-year-old males from Lima in the Covid. Csv ile.
HINT:you could search the Covid. Csv ile for the rows that contain Lima and then search within those rows for rows that contain male and then search within those rows for rows that contain 52 and then count the number of those rows.
The result of your code would look like this:
65
[5 marks]
3. [10 marks]
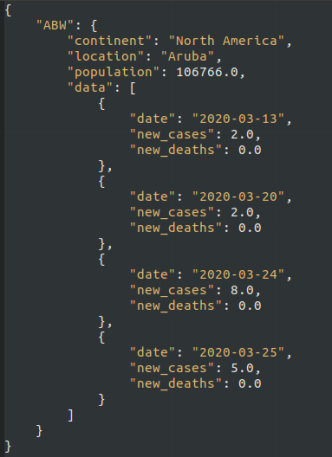
This question relates to the the JSON ile)Ⅱcovid. jsonⅡ) shown below.
This is similar to)but NOT exactly the same as the JSON iles used in the course lab work.
(a) write down the result of the following R code.
> 1ibrary(json1ite)
> fromJSON(readLines("covid.json"))
[5 marks]
(b) A MongoDB database called covid contains a large number of documents with the same structure as the ile "covid. json".
write R code to query the covid database and extract ONLY the continent and location for records with population greater than 100,000,000 and location not equal to "world".
The output of your code would look like this:
continent location
1 Asia Bangladesh
2 south America Brazil
3 Asia china
4 Africa Egypt
5 Africa Ethiopia
6 Asia Indonesia
7 Asia India
8 Asia Japan
9 North America Mexico
10 Africa Nigeria
11 Asia pakistan
12 Asia philippines
13 Europe Russia
14 North America united states
[5 marks]
4. [5 marks]
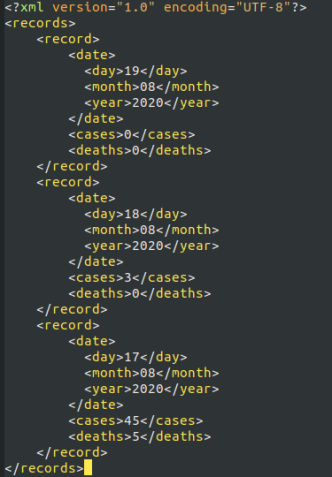
This question relates to the the XML ile)"covid. xml")shown below.
This is similar to)but NOT exactly the same as the XML ile used in the course lab work.
(a) write R code that reads the XML ile into R and uses an Xpath expression to select the cases when the day is greater than 17 and produces a numeric vector.
The output of your code would look like this:
[1] 0 3
[5 marks]
2023-08-22