Summary Statistics
Hello, dear friend, you can consult us at any time if you have any questions, add WeChat: daixieit
Background
Pre-processing data to bring it into a usable form is a crucial first step in any data science investigation.
In this assignment, you will be be working with a sample dataset containing news articles from the American news provider Fox news. As with most real-word data files, the data is not in a clean, consistent format. In this assignment, you will use Python to clean the data file and perform some preliminary analysis.
Tasks (10 marks)
Task 1: Summary Statistics (1 marks)
Implement the function task1(..) in task1.py that takes one argument:
· The filename of the data file containing the news articles.
Your function should load in the specified data file and print the number of rows and columns to the screen in the following format:
Number of rows: X
Number of columns: Y
You are free to write any helper functions (even in another file) if you like, but do not change the function definition of task1(..). For example, do not add any additional arguments to task1(..). This applies to all tasks.
To allow for testing, you should also return the strings you print in a list with one line per string.
To run your solution, open the terminal and run python main.py task1 full . You can verify your answer against the sample data using python main.py task1 sample, this will check the output against the sample data.
Note that for all tasks, the sample data verification is not intended to verify the correctness of your approach or the structure of your solution. Verifying your output and process are correct is part of all tasks, so you should treat it as a sanity check, ensuring you haven't missed any aspects of basic formatting. In all tasks, this sample used for verification should be considered arbitrarily selected, so there is no implicit guarantee or expectation that it will cover all cases or highlight issues present in the full scale task.

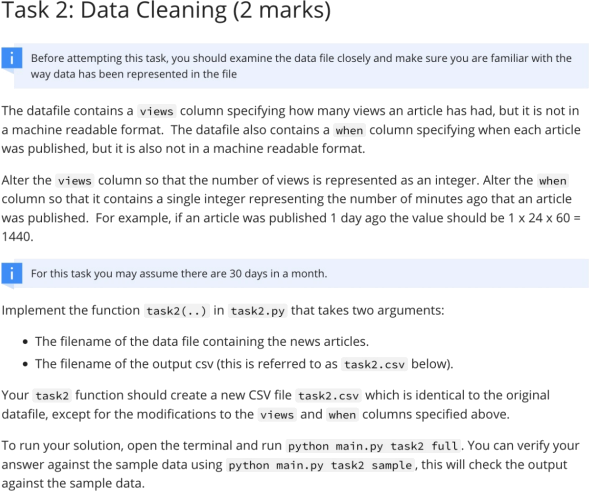
Task 2: Data Cleaning (2 marks)
Before attempting this task, you should examine the data file closely and make sure you are familiar with the way data has been represented in the file
The datafile contains a views column specifying how many views an article has had, but it is not in a machine readable format. The datafile also contains a when column specifying when each article was published, but it is also not in a machine readable format.
Alter the views column so that the number of views is represented as an integer. Alter the when column so that it contains a single integer representing the number of minutes ago that an article was published. For example, if an article was published 1 day ago the value should be 1 x 24 x 60 = 1440.
For this task you may assume there are 30 days in a month.
Implement the function task2(..) in task2.py that takes two arguments:
· The filename of the data file containing the news articles.
· The filename of the output csv (this is referred to as task2.csv below).
Your task2 function should create a new CSV file task2.csv which is identical to the original datafile, except for the modifications to the views and when columns specified above.
To run your solution, open the terminal and run python main.py task2 full. You can verify your answer against the sample data using python main.py task2 sample, this will check the output against the sample data.

Task 3: Preliminary Visualisation (1 mark)
Implement the function task3(..) in task3.py that takes two arguments:
· The filename of the data file containing the news articles. You should assume the datafile provided to this function has already been cleaned according to the rules specified in Task 2.
· The filename the image will be output to (this is referred to as task3.png below).
Your function should produce a scatter plot comparing the number of minutes ago an article was published with the number of views. Your plot should only include articles posted within the last 10 days (14,400 minutes).
The scatter plot should be saved as task3.png
To run your solution, open the terminal and run python main.py task3 full - this will first run task2 and then use the output of task2 as input to task3.
Consider the elements of a useful visualisation. Visualisations that are difficult to read or interpret will receive fewer marks.

Task 4: Text Preprocessing (1 mark)
We now wish to understand which words appearing in an article title are most related to a high view count. Before we can do so, we need to pre-process each title into a list of words contained in the article.
For each article title do the following:
· Remove all non-alphabetic characters other than space characters
· Convert all capital letters to lower case
· Tokenize each title into a list of words, treating spaces as the boundary between tokens.
Implement the function task4(..) in task4.py that takes two arguments:
· The filename of the data file containing the news articles. You should assume the datafile provided to this function has already been cleaned according to the rules specified in Task 2.
· The filename of the output dataframe (this is referred to as task4.csv below).
Your task4 function should create a new CSV file task4.csv which is identical to the original datafile, except that it should contain an additional column words containing the list of words in the title, pre-processed according to the rules above.
To run your solution, open the terminal and run python main.py task4 full. You can verify your answer against the sample data using python main.py task4 sample, this will check the output against the sample data.

Task 5: Preliminary Analysis (2 marks)
We now wish to understand which words appearing in an article are most related to a high view count. Consider the vocabulary of all words that appear in at least five article titles. For each word in the vocabulary, calculate the average number of views over all articles where that specific word appears at least once.
Implement the function task5(..) in task5.py that takes three arguments:
· The filename of the data file containing the news articles. You should assume the datafile provided to this function has already been cleaned according to the rules specified in Task 4.
· The filename of the output JSON format file (referred to below as task5.json).
· The filename of the output image file (referred to below as task5.png).
Your function should generate dictionary of key/value pairs. Each word in the vocabulary should be a key in the dictionary, and the associated value should be the average number of views over all articles in which that word appears at least once, rounded to the nearest whole number. The dictionary should be exported to a JSON file as task5.json.
Your function should further produce a bar chart showing the average number of views for the five words with the highest average_views, saved as task5.png.
Consider the elements of a useful visualisation. Visualisations that are difficult to read or interpret will receive fewer marks.
To run your solution, open the terminal and run python main.py task5 full. You can verify your answer against the sample data using python main.py task5 sample, this will check the output against the sample JSON data.

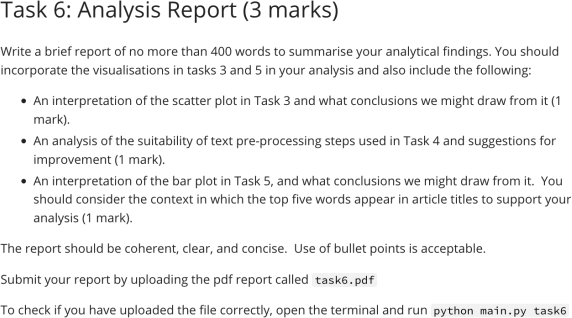
Task 6: Analysis Report (3 marks)
Write a brief report of no more than 400 words to summarise your analytical findings. You should incorporate the visualisations in tasks 3 and 5 in your analysis and also include the following:
· An interpretation of the scatter plot in Task 3 and what conclusions we might draw from it (1 mark).
· An analysis of the suitability of text pre-processing steps used in Task 4 and suggestions for improvement (1 mark).
· An interpretation of the bar plot in Task 5, and what conclusions we might draw from it. You should consider the context in which the top five words appear in article titles to support your analysis (1 mark).
The report should be coherent, clear, and concise. Use of bullet points is acceptable.
Submit your report by uploading the pdf report called task6.pdf
To check if you have uploaded the file correctly, open the terminal and run python main.py task6
2023-08-21
Pre-processing data to bring it into a usable form is a crucial first step in any data science investigation.