F2019STAT213.30071019.STAT_213_Assignment_7
The number of attempts available for each question is noted beside the question. If you are having trouble figuring out your error, you should consult the textbook, or ask a fellow student, one of the TA’s or your professor for help. There are also other resources at your disposal, such as the Mathematics Continuous Tutorials. Don’t spend a lot of time guessing – it’s not very efficient or effective.
Make sure to give lots of significant digits for (floating point) numerical answers. For most problems when entering numerical answers, you can if you wish enter elementary expressions such as 2 ^ 3 instead of 8, sin(3 ∗ pi=2)instead of -1, e ^ (ln(2)) instead of 2, (2+tan(3)) ∗ (4-sin(5)) ^6-7=8 instead of 27620.3413, etc.
1. (1 point) You have information to suggest that a certain continuous variable of a population has a mean of µ = 13:85 and a standard deviation of s = 5:42. You are to randomly pick n = 76 individuals from this population and observe the value
of the population variable on each . This value is to measured as Xi. After the random sample of n = 76 has been taken, you are asked to consider the behavior of the statistic X.
(a) Complete the statement below. Use at least two decimals in each numeric answer.
The distribution of X
• ?
• is approximately Normal
• is exactly Normal
• is skewed to the right
• has an unknown shape
with a mean µX = and a standard deviation sX =
(b) Find the probability that mean of the sample of n = 76 is between 13.15 and 14.05. Use at least four decimals in your z-values, and enter your answer to at least four decimals.
Answer(s) submitted:
•
•
•
•
(incorrect)
2. (1 point) You are interested in finding out the mean number of customers entering a 24-hour convenience store every 10-minutes. You suspect this can be modeled by the Poisson distribution with a a mean of l = 3:1 customers. You are to randomly pick n = 53 10-minute time frames, and observe the number of customers who enter the convenience store in each.
After which, you are to average the 53 counts you have. That is, compute the value of X.
(a) What can you expect the value of X to be?
Enter your answer using all the decimals you can.
(b) Find the value of the standard deviation of X. Enter your
answer using all the decimals you can.
sX =
(c) Find the probability that mean of the sample of 53 is between 2.6 and 3.3. If rounding only round once, at the end do not round before that. Ensure you use at least four decimals in your z-values.
P(2:6 ≤ X ≤ 3:3) = Use at least four decimals in your answer.
(d) 93% of the time, the observed value of X will exceed what value?
(use at least four decimals in your answer)
Answer(s) submitted:
•
•
•
•
(incorrect)
3. (1 point) Once checked in at the ticket kiosk, the amount of time it takes a airline passenger at the Calgary International Airport to clear security is a random variable that can be modeled by the Exponential distribution with a µ = 37:1 minutes.
A statistician is randomly select n = 35 airline passengers and record how long, in minutes, it takes each to clear security once each has checked in at the ticket kiosk.
(a) Complete the statement below. Enter your answer using all the decimals you can.
The distribution of X
• ?
• is approximately Normal
• is exactly Normal
• is skewed to the right
• is Exponential
• is Poisson
• has an unknown shape
with a mean µX = minutes and a standard deviation
sX = minutes.
(b) What is the probability that the average time for this sample of n = 35 airline passengers to clear security is between 28 minutes and 51 minutes? Enter your answer using all the decimals you can.
(c) 95% of the time, the mean time it takes n = 35 airline passengers to clear security after ticket kiosk check-in is at most how many minutes? Enter your answer using all the decimals you can. minutes
Answer(s) submitted:
•
•
•
•
•
(incorrect)
4. (1 point) You are to roll a fair die n = 115 times, each time observing the number of dots appearing on the topside of the die. The number of dots showing on the topside of toss i is a random variable represented by Xi, i = 1;2;··· ;115.
(a) Consider the distribution of the random variable Xi. Find the mean and the standard deviation of the number of dots showing on the uppermost face of a single roll of this die.
µXi = Enter your answer using all the decimals you can.
sXi = Enter your answer using all the decimals you can.
(b) Now think about the average of your n = 115 tosses of the fair die. What can you say about the distribution of this average? Complete the sentence, Enter your answer using all the decimals you can.
The distribution of X
• ?
• is approximately Normal
• is exactly Normal
• is skewed to the right
• is Uniform
• has an unknown shape
with a mean µX = and a standard deviation sX =
(c) What is the probability that the average topside on your n = 115 tosses will be somewhere between 3.3 and 3.7? Enter your answer using all the decimals you can.
(d) What is the probability that the average of your n = 115 tosses is greater than 4.15? Enter your answer using all the decimals you can.
Answer(s) submitted:
•
•
•
•
•
•
•
(incorrect)
5. (1 point) Recent polls indicate that if a federal election would be held today, 32.3% of Canadian voters would cast his/her vote for the Liberal Party candidate in his/her riding.
Suppose you are a political pollster, and you are to randomly pick n = 371 Canadian voters, asking each Which political party will you support in the next federal election?
(a) What can you expect the value of pb to be?
Enter your answer using all the decimals you can.
(b) Find the value of the standard deviation of pb. Enter your answer using all the decimals you can.
(c) Find the probability that proportion of your sample of 371 that will indicate support for the Liberal Party is at least 30% to at most 36%. Enter your answer using all the decimals you can.
P(0:3 ≤ pb≤ 0:36) =
(d) 4% of the time, the observed value of your statistic pbwill exceed what value? Enter your answer using all the decimals you can.
Answer(s) submitted:
•
•
•
•
(incorrect)
6. (1 point) A recent poll indicated that 30.7% of Canadians planned on attending a Remembrance Day Ceremony this year.
A statistician is randomly select n = 503 Canadians aged 18 or over, and ask each one if he/she plans on attending a Remembrance Day Ceremony this year.
(a) Complete the statement below. Enter your answer using all the decimals you can.
The distribution of p
• ?
• is approximately Normal
• is exactly Normal
• is skewed to the right
• is Exponential
• is Poisson
• is Binomial
• has an unknown shape
with a mean µpb = and a standard deviation spb =
(b) What is the probability that the proportion/percentage of the n = 503 Canadians sampled who plan on attending a Remembrance Day Ceremony is between 28% and 35%? Enter your answer using all the decimals you can.
(c) Find the probability that the value of the sample proportion/percentage will be at most 24% P(pb ≤ 0:24) = Enter your answer using all the decimals you can.
Answer(s) submitted:
•
•
•
•
•
(incorrect)
7. (1 point) You are to roll a fair die n = 118 times, each time observing if the topside of the die shows a 6 (success) or not (failure). After observing the n = 118 tosses, you are to count the number of times the topside showed a 6. This count is represented by the random variable X.
(a) The distribution of X
• ?
• is approximately Normal
• is exactly Normal
• is Binomial
• is Uniform
• is Hypergeometric
• is Poisson
. with a mean and a standard deviation . Enter your answer using all the decimals you can.
(b) Now think about the proportion of your n = 118 tosses that show a six. What can you say about the distribution of this proportion? Complete the sentence, Enter your answer using all the decimals you can. The distribution of p
• ?
• is approximately Normal
• is exactly Normal
• is skewed to the right
• is Uniform
• has an unknown shape
• is Binomial
• is Poisson
with a mean µp = and a standard deviation sp =
(c) What is the probability that the proportion/percentage of your n = 118 tosses that show a six will be somewhere between 15% and 22%? Enter your answer using all the decimals you can.
(d) After the n = 118 tosses of the die, you observe X = 26, the value of the sample proportion is then pb = 118 26 = 0:2203. What is the probability of observing a sample proportion that is at least this much should you decide to roll this die again 118 times? Enter your answer using all the decimals you can.
Answer(s) submitted:
• • • • • • • •
(incorrect)
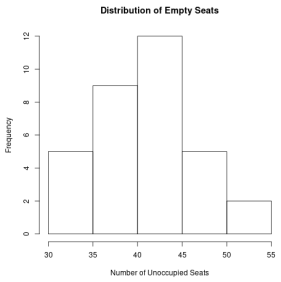
8. (1 point) A certain airline wishes to estimate the mean number of seats that are empty on flights that use 737-airplanes. There are 189 seats on a 737. To do so, the airline randomly picks n = 33 flights. For each flight, the number of empty seats is counted. The data are given below.
48, 32, 53, 40, 44, 32, 49, 38, 35, 41, 43, 42, 49, 45, 40, 47, 43, 37, 39, 36, 44, 37, 46, 30, 41, 42, 30, 51, 41, 36, 45, 36, 45
Data from the sample, are saved in the Download .csv file.
(a) Find the mean and the standard deviation of this sample. Use at least three decimal places in each answer.
X = empty seats
S = empty seats
(b) To construct a confidence interval for the mean number using the T distribution for unoccupied seats on all flights that use 737s, what condition must you hold?
• A. The number of unoccupied seats are not normally distributed.
• B. The sample size is sufficiently large for the Central Limit Theorem to provide a valid approximation.
• C. That the number of unoccupied seats are normally distributed.
• D. The number of unoccupied seats can be modeled by the Binomial distribution.
(c) Find a 95% Student T confidence interval for µ, the mean number of empty seats on this airline’s flights that use 737s. Use at least three decimal points for your lower and upper bounds. To avoid rounding errors you should use R-Stuido and not Tables.
Lower Bound = empty seats
Upper Bound = empty seats
(d) Find a 95% confidence interval for µ, the mean number of empty seats on this airline’s flights that use 737s, by Bootstrapping 1000 samples. Use the seed 7144 to ensure that R-Studio”randomly” samples the same ”random” samples as this question will expect.
You can do this by including the code, you can copy it into your R-Studio to bootstrap your samples.
RNGkind(sample.kind=”Rejection”);
set.seed(7144);
B=do(1000) * mean(resample(c(48, 32, 53, 40, 44, 32, 49, 38, 35, 41, 43, 42, 49, 45, 40, 47, 43, 37, 39, 36, 44, 37, 46, 30, 41, 42, 30, 51, 41, 36, 45, 36, 45), 33));
Ignore any errors or warnings that show up.
Use at least three decimal points for your lower and upper bounds.
Lower Bound = empty seats
Upper Bound = empty seats
Answer(s) submitted:
• • • • • • •
(incorrect)
9. (1 point) A poll of n voters is to be taken in an attempt to
predict the outcome of a by-election in a certain riding. Specifically, you are interested in the proportion of voters that will vote for a certain candidate, Candidate A.
n = 484 voters have been randomly chosen, each has indicated what candidate they will vote for. You are to count the number, out of 484, who say they will vote for Candidate A. This count is measured by the random variable X. You find X = 133.
(a) Find a 90% confidence interval for p, the proportion of all voters who will vote for Candidate A. Use the Z distribution to create your confidence interval. Use at least four decimal points for your lower and upper bounds. At avoid rounding errors you should use R-Stuido and not Tables.
Lower Bound =
Upper Bound =
(b) Interpret the meaning of the interval you found in part (a) .
The proportion of
• ?
• all voters in the riding
• all voters
• all people
that will vote for Candidate A is
• ?
• somewhere between
• outside of the interval
% and %. (Enter your answer to at least two decimals.)
(c)
Find a 90% confidence interval for for p, the proportion of all voters who will vote for Candidate A, by Bootstrapping 1000 samples. Use the seed 596 to ensure that R-Studio ”randomly” samples the same ”random” samples as this question will expect.
You can do this by including the code, you can copy it into your R-Studio to bootstrap your samples.
RNGkind(sample.kind = ”Rejection”);
set.seed(596);
B=do(1000) * mean(resample(c(rep(1,133),rep(0,484-133)), 484));
Find a 90% confidence interval Use at least four decimal points for your lower and upper bounds.
Lower Bound =
Upper Bound =
Answer(s) submitted:
• • • •
• • • •
(incorrect)
10. (1 point) LDL - low density lipoprotien - cholesterol is considered the bad cholesterol. A pharmaceutical company conducts a clinical trial on people with high levels of LDL cholesterol. The trial involves a random sample of n = 16 persons who have high levels of LDL. Each person has their LDL level measured prior to the beginning of the drug trial. Each person is then to take a new drug that is believed to lower ones LDL levels. After a period of 4-weeks, the LDL level of each person is measured again. The difference between the initial LDL level and the LDL-level four weeks after taking the drug is then computed.
-0:38;-0:24;-0:89;-0:09;-0:85;-0:56;-0:62;-0:54;-0:34;-0:79;-0:48;0:16;-0:27;-1:12;-0:36;-0:02
Data from the sample, are saved in the Download .csv file.
Assuming the difference in the LDL-levels is Normally distributed, find a 95% confidence interval for µ, the mean difference in the LDL-level of a person after taking the drug for four weeks. Use at least four decimals for your lower and upper bounds. To avoid Rounding errors you use use R-Studio and not Tables.
≤ µ ≤
2019-12-05
Answer(s) submitted:
• •
(incorrect)
11. (1 point) An environmentalist wishes to survey Canadians to determine what percentage support strict environmental controls on the Oil and Gas Industry.
The environmentalist randomly picks n = 800 Canadians, and finds that 591 favour strict environmental controls on the Oil and Gas Industry.
(a) Find a 99% confidence interval for p without using a bootstrap sample. Use at least four decimal points for your lower and upper bounds.
Lower Bound =
Upper Bound =
(b) Interpret the meaning of the interval you found in part(a) .
• ?
• The proportion of all Canadians
• The proportion of all Canadians sampled
• all people
who support strict environmental controls on the Oil and Gas Industry is
• ?
• somewhere between
• outside of the interval
% and %. (Enter your answer to at least two decimals.)
Answer(s) submitted:
• • • • • •
(incorrect)
12. (1 point) You are interested in estimating µA, the mean monthly rate of return of the stock of Company A listed on the
Toronto Stock Exchange. You randomly pick n = 35 months, for each you observe the monthly rate of return of Company A stock. You have observed the following data, in %. 5.51, 5.94, 6.11, 0.33, 9.51, 7.15, 3.39, 3.12, 4.37, 1.37, 5.63, 7.3, 6.2, 7.38, 6.25, 2.24, 5.09, 8.22, 7.96, 6.9, 3.93, 6.42, 1.29, 4.3, 3.45, 4.12, 2.83, 6.62, 5.43, 2.73, 5.95, 3.39, 5.46, 7.39, 6.71
Data from the sample, are saved in the Download .csv file.
(a) Find a 91% confidence interval for µA, by Bootstrapping 1000 samples. Use the seed 6669 to ensure that R-Studio ”randomly” samples the same ”random” samples as this question will expect. Use at least 4 digits after the decmial if rounding.
You can do this by including the code, you can copy it into your R-Studio to bootstrap your samples.
RNGkind(sample.kind = ”Rejection”);
set.seed(6669);
B=do(1000) * mean(resample(c(5.51, 5.94, 6.11, 0.33, 9.51, 7.15, 3.39, 3.12, 4.37, 1.37, 5.63, 7.3, 6.2, 7.38, 6.25, 2.24, 5.09, 8.22, 7.96, 6.9, 3.93, 6.42, 1.29, 4.3, 3.45, 4.12, 2.83, 6.62, 5.43, 2.73, 5.95, 3.39, 5.46, 7.39, 6.71), 35));
Ignore any errors or warnings that show up.
lower bound =
upper bound =
(b) From the from 91% confidence interval found in (a) , can you conclude that the mean monthly rate of return of Company A stock is 7%, or µA = 7%?
[?/No/Yes] because the [?/upper bound/lower bound] of the
91% confidence interval is
• ?
• less than
• not less than
• greater than
7%.
(c) From the from 91% confidence interval found in (a) , can you conclude that the mean monthly rate of return of Company A stock greater than 5.6%, or µA > 5:6%?
[?/No/Yes] because the [?/upper bound/lower bound] of the
91% confidence interval is
• ?
• less than
• not less than
• greater than
5.6%.
Answer(s) submitted:
• • • • • • • •
(incorrect)
13. (1 point) Statistics Canada conducts an annual survey to estimate the proportion of Canadians aged 20 - 24 years of age who are smokers. The most recent application of the Canadian Tobacco Monitoring Survey involved a random sample of n = 306 Canadians aged 20 to 24 years of age. Each was asked for the smoking status. The number of 20 to 24 year-olds sampled who indicated they were smokers was 263.
(a) Compute the sample proportion. Use at least four decimals in your answer.
p=