FIN5004 Financial Trading 2022
Hello, dear friend, you can consult us at any time if you have any questions, add WeChat: daixieit
DIPLOMA PROGRAMMES
MAIN ASSESSMENT
Date: 26 August 2022
Module: FIN5004 Financial Trading
Time: 14:15 - 16:15
Duration: 2 hours
Total no. of pages: 5 + 2 pages of Appendix
SECTION A
Answer ALL questions.
Question 1
Chart Pattern
(a) With the help of a clearly labelled price and volume diagram, describe a wedge in a downtrend. (5 marks)
(b) List FIVE (5) characteristics of the above pattern. (5 marks)
Candlestick Patterns
(c) With the help of a clearly labelled diagram, describe the five-candlestick pattern
- Falling Three Method. Indicate if this is a bullish/bearish and continuation/reversal pattern. (7 marks)
(d) Give FIVE (5) characteristics of the pattern described in Question 1(c). (5 marks)
(e) List THREE (3) important considerations when evaluating candlesticks and candlestick patterns. (3 marks)
Question 2
Moving Averages
(a) Calculate:
(i) 5-day Simple Moving Average (SMA) (3 marks)
(ii) 5-day Weighted Moving Average (WMA) (6 marks)
(iii) 5-day Exponential Moving Average (EMA) (4 marks)
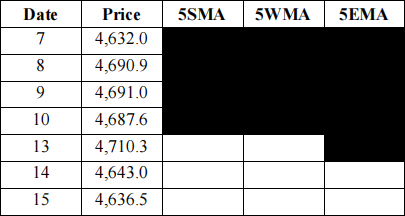
Note: Give answers in the above table to ONE (1) decimal place. Show all workings and steps in the answer booklet.
(b) Give the advantages and disadvantages of the Moving Average indicator. (2 marks)
Fibonacci Expansion Ratios
(c) The stock price of DBS bank has continued to climb higher after hitting a low of $15.33 at the onset of the COVID- 19 pandemic. Even the emergence of the Omicron variant did not hold back the price as it rose to an all-time high of $32.70. After retreating to $29.87, it again attempts to break the recent high. If the high of $32.70 is broken, what are the THREE (3) target prices using the Fibonacci expansion ratios? (7 marks)
(d) When are the Fibonacci expansion ratios particularly helpful? (3 marks)
SECTION B
Answer ALL questions.
Write your index number and seat numbers and all answers on the charts in Appendix A. Appendix A is to be attached to and submitted with your answer booklets. DO NOT write your name in Appendix A.
Question 3
(a) With the help of suitable annotations and lines, indicate the market trends on the chart for the periods Aug 2007 to Nov 2008 and Oct 2008 to Jun 2009. (4 marks)
(b) From Oct 2008 to the end of the chart, indicate with suitable annotations and lines, the chart pattern that was formed. Name the pattern and include the expected price objective (in $) when the pattern is fully formed. (4 marks)
(c) With the help of suitable annotations and arrows, indicate TWO (2) Bullish Divergence signals on the chart. (4 marks)
(d) Reference to the high (18,315) and low (6,830) prices given on the chart.
Calculate the FOUR (4) Fibonacci Retracement levels to the nearest whole number, and indicate the price levels and the respective percentages on the chart. Show all workings on the chart. (8 marks)
(e) With regards to the interactions between a 10-day and 40-day Moving Averages from a downtrend to an uptrend, elaborate on the Early, Intermediate and Final signals. (5 marks)
Question 4
(a) With the help of suitable annotations and lines, indicate the market trends on the chart for the following periods:
(i) from the beginning of the chart to June
(ii) June to November
(iii) November to the end of the chart. (6 marks)
(b) From September to the end of the chart, indicate with suitable annotations and lines, the chart pattern that has formed. Name the pattern and include the price objective expected. (4 marks)
(c) Referring to the period from June to November, mark-out TWO (2) Buy signals (mark B) generated by the Stochastic Indicator. Circle the Buy signals (B) on both the price and indicator. Give ONE (1) reason why only Buy trades are considered. (4 marks)
(d) Reference to the arrows marked ‘P’ on the chart. Describe the applications of the Bollinger Bands when the ‘pinching’ of the bands is observed. (6 marks)
(e) Reference to the candle within the circle marked ‘Q ’. Name the candle and
describe FOUR (4) attributes of the candle. (5 marks)
2023-08-16