Econ 259 Final Exam Summer 2023
Hello, dear friend, you can consult us at any time if you have any questions, add WeChat: daixieit
Econ 259
Take-home Final Exam Points possible = 100
Online final exam is due at 5:00 PM on Aug 18
Instructions:
1. This test is an individual take-home exercise. Please do not consult anyone else in the process of completing the test questions.
2. Do not communicate with anyone about the exam questions until after the due date.
3. Once you have completed the scenarios in this document, please open the online quiz
named “final exam” and complete the multiple-choice questions/short answer questions based on this take-home exercise.
4. Please expect a total of 18 questions in the online final exam, some questions will require your answers, some questions will serve as placeholders forme to evaluate the content in your Excel file (these questions will be marked as “placeholders”). The 18th question is an honor statement that requires you to enter your name in the text box directly
underneath the statement if the statement is true. Please read the online exam questions carefully before providing any answers.
5. Please note that the online “final exam” is timed for 2 hours (only one attempt is allowed) and is due at the due date specified on Canvas, no late submissions will be allowed.
6. Mark your answers on the completed excel worksheets, create ONE Excel
file/workbook to answer all questions and display each question on a separate worksheet (please name each worksheet accordingly).
7. Read each question carefully and name the excel workbook/file and worksheets as required.
8. Upload your ONE completed excel workbook to the “final exam workbook upload” tab under Assignments on Canvas before 5:00 PM on Aug 18. If you fail to supply the
completed excel file (screenshots are not acceptable) on time, 40 points will betaken away from your final exam automatically.
9. When uploading your one Excel file (with multiple worksheets), please title your completed excel workbook/file as “your full name_259_final”.
10. Grading details for each question are included at the end of each question, please use this information to guide your answers in the online final exam.
Q1 (20 points). The file “MBA application” includes a sample of individuals who have received an undergraduate degree and are currently working in the industry. You would like to explore the factors that determine their likelihood to apply to the MBA programs in the country. The data
includes their family size, their current salary, their undergraduate GPA, and whether they have applied to at least one MBA program in the nation at the time of the survey. Use Pivot Table to identify the following values:
1. Percentage of individuals who earn high salaries with low undergraduate GPA choose to apply to the MBA programs.
2. Percentage of individuals who earn low salaries from small family choose NOT to apply to the MBA programs.
3. Percentage of individuals who have small family and low GPA choose to apply to the MBA programs.
4. What factors seem to affect an individual’s likelihood to apply to the MBA programs in the data?
Please note: Name the worksheet “your lastname_Q1” .
Grading for Q1:
1. Three multiple choice questions relating to question 1. (4 points each, total 12 points) 2. One short answer question. (total 4 points)
3. Has the student provided sufficient evidence in the Excel workbook to answer the above four questions relating to Q1? (4 points)
Q2 (26 points). Considering the same background information discussed in the refinery business case, the refinery business transforms two types of crude oil (heavy and light) into higher value refined petroleum products (gasoline, diesel, and others). Three pieces of equipment are needed to refine crude oil: distillation equipment, conversion equipment, and blending equipment. The
following updated information has been provided by the president of the company after renegotiating contracts with their current suppliers and distributors:
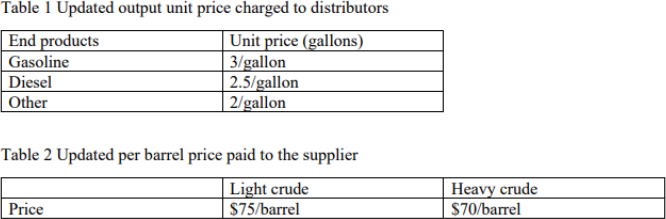
Current production policy is to process 600,000 barrels of light crude oil and 200,000 barrels of heavy crude oil. All other information regarding production (crude input and output, refining
equipment demand per 1,000 barrels,weekly available equipment hours, fixed overhead,
variable overhead, and labor costs) stay the same (as described in the case). Based on the updated information, the president would like to know whether the current production policy is optimal.
Please use Solver Simplex LP (as discussed in class) to answer the following questions:
1. What is the per barrel contribution for each type of crude oil?
2. What is the total profit under the current production policy? Hint: Total profit = [total contribution] – [fixed overhead]
3. Assuming the goal is to maximize total contribution, how many barrels of each type of crude should the refinery produce? Hint: two types of constraints need to be imposed (resource
constraint and non-negativity constraint).
4. What is the new total contribution and the new profit with the optimal input mix?
5. How much more contribution can the refinery add if available equipment hour per week for blending equipment increases by 200 hours, when keeping all other parameters unchanged?
Please note: Name the worksheet “your lastname_Q2”.
Grading for Q2:
1. 5 multiple choice questions. (4 points each, total 20 points)
2. Has the student provided sufficient evidence in the Excel workbook to answer the above five questions relating to Q2? (6 points)
Q3 (18 points). Download the data file named “Q3 data_final”. Please complete the following tasks:
1. On a separate worksheet, run a correlation matrix with the following variables: ROA, tsale, tasset, TNMW, ttd, capital intensity, and debt ratio. Highlight the correlation
between variable “tsale” and variable “tasset” on the worksheet.
2. On a separate worksheet, create a linear regression analysis by using ROA as the dependent variable. Use TNMW (total number of managerial workers),ttd (total training and development expenditure), capital intensity, and debt ratio as the
independent variables in your analysis. Highlight the variable (s) that significantly predict the dependent variable. No need to highlight if none of the independent
variables has a significant impact on the dependent variable.
Name the worksheet “your lastname_Q3” .
Grading for Q3 (no questions will need to be answered for Q3 when completing the online exam, show process and solutions on your Excel worksheet):
1. Setup the worksheets with key information needed to perform the analysis. (13 points) 2. Perform the analysis accurately and highlighted the cells as instructed. (5 points)
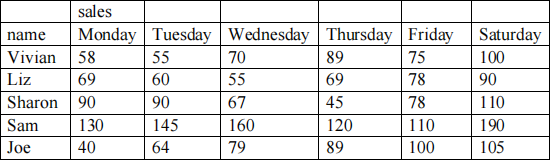
Q4 (18 points). You are given the following unit sales data for five sales associates from
Monday to Saturday. Please setup a worksheet (name the worksheet “your lastname_Q4”) to complete the following tasks:
1. Rank your employees by units of product sold for each day during the week (descending order). Hint: use the “rank” function to complete the performance ranking.
2. Use the icons introduced in class to track the daily change in performance ranking over the week (up, down, or stays the same) for each individual sales associate. Hint: use “IF” statement to complete this question.
Grading for Q4 (no questions will need to be answered for Q4 when completing the online final exam, show process and solutions on your Excel worksheet):
1. Setup the worksheet with key information needed to complete the above two tasks. (12 points)
2. All calculations are correctly done. (6 points)
Q5 (18 points). You are saving for your dream house. You are going to contribute the same
amount of money to the dream house fund at the end of each year. Your goal is to end up with
$100,000. You are not quite sure about the annual investment returns of the fund, but they should range from 4 percent through 15 percent. You are also not quite sure about the number of years
you will invest into the dream house fund. But the number of years investing should vary from 5- 15 years. Please perform the following analysis:
1. Use a two-way data table to determine how your required annual contribution is going to change as annual investment returns change (with 1 percent increment) and as years
investing change (with 1 year increment).
2. Use scenario managers to produce a scenario summary report to show how your required annual contribution is going to change as scenario changes. The four scenarios have been provided in the table below:
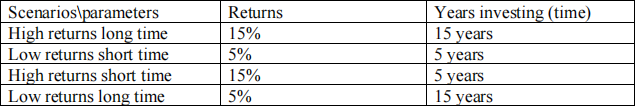
Hint: use the PMT function to calculate your required annual contribution. Name your worksheets as “Q5 data table” and “Q5 scenario summary”.
Grading for Q5:
1. One multiple choice question. (4 points)
2. Setup Excel worksheets that include the correctly calculated two-way data table and scenario manager report as shown in class. (14 points)
2023-08-14