MOCK EXAM
Hello, dear friend, you can consult us at any time if you have any questions, add WeChat: daixieit
MOCK EXAM
Q1: Use the four (4) levels of systems thinking to explain the case of Du Pont and, explain why a focus on reactive maintenance led to unintended consequences (4 marks)
Note: This mock answer weaves the four levels into the answer – an alternative (and most acceptable) is to give sub-headings of ‘events’, ‘patterns’, ‘system structures’, ‘mental models’ and write a sentence or each. Note that for this question, there would be marks allocated simply for stating the 4 levels.
The four levels of systems thinking are Events, Patterns, System Structures and Mental Models. We manage system structures based on our mental models. These system structures generate patterns and trends, which in turn lead to events.
Apply to the case of Du Pont:
In 1991, Du Pont did a benchmarking study which revealed that it spent 10% to 30% more on maintenance per dollar of plant value and had 10 to 15% lower plant uptime compared to its competitors. Du Pont’s maintenance policy focused on reactive maintenance, which is the repair of equipment once it breaks. This was an ‘if it’s not broken, don’t fix it’ mental model. This mental model lead to a focus on reactive maintenance, which triggered unintended consequences within the system structure they were managing:
Equipment defects are created through normal equipment operations and can be removed once equipment breaks through reactive maintenance or before equipment breaks through planned maintenance. Both breakdowns requiring reactive maintenance, and takedowns requiring planned maintenance, reduce plant uptime.
Du Pont’s focus on reactive maintenance meant that they ran equipment until breakdowns occurred, this created collateral damage, leading to more defect creation and more breakdowns. This reinforcing loop increased the breakdown rate over time. The increasing breakdown rate also triggered two more reinforcing loops:
- It reduced plant uptime, which increased pressure to keep equipment running, which reduced the takedown rate and the planned maintenance effort. This reduced defect elimination through planned maintenance, which increased equipment defects and breakdowns
- It increased the reactive maintenance effort, which reduced the mechanics available for planned maintenance. This reduced defect elimination through planned maintenance, which increased equipment defects and breakdowns.
Therefore the focus on reactive maintenance led to the patterns of increasing breakdowns, increasing maintenance costs and reduced plant uptime, and these patterns eventually led to an event, which was 10% to 30% higher maintenance costs per dollar of plant value and 10 to 15% lower plant uptime compared to its competitors.
Q2: The fifth step in the systems modelling process involves designing and testing policies using your simulation model. Describe the main tests you can do using examples (4 marks)
Note: For this type of question, unless otherwise stated, you can use a UQ Case e.g. MacQuarie Island, The Lobster Game – one of the motivators for the early introduction of MacQuarie Island, Lobster Game and the Tourist Game cases is that it gives exposure to using a model.
The fifth step in the systems modelling process involves designing and testing policies using your simulation model. This involves:
1. Creating new system structures, such as changing or adding feedback loops.
2. Creating new decision rules, changing time delays and material and information flows within the system.
3. Testing the robustness of policies under extreme conditions.
4. Testing multiple policies to see if they interfere with or reinforce each other.
Take a model that simulates population and trees on Easter Island. When we run this model, the trees are eventually consumed by the population, causing the population to collapse. We may want to test a tree replanting policy to see if this allows the trees and population to recover. To do this, we can add a new structure to the system to simulate the replanting and maturation of trees. When we run the model with the tree replanting policy we see that it does allow the trees and population to recover.
Say we wanted to test the tree replanting policy under an extreme condition, which in this example could be a cyclone that kills all of the planted saplings and half of the mature trees. When we run the model again to simulate the effect of a cyclone, we find that the trees and population temporarily decline but then recover due to tree replanting. Therefore the tree replanting policy seems reasonably robust under this extreme condition.
Q3: Describe the issue of polarity switching using an example. Include all loop labels and polarities. Explain how you address this issue when drawing causal loop diagrams (4 marks)
Note: you can use the example provided in the lecture video, but you must re-create it using Vensim or Stella i.e. do not copy and paste
Polarity switching occurs when the polarity between a pair of variables can be positive or negative. The effect of fertiliser on plant growth is an example. If a plant is fertilised, its growth will improve. However, if too much fertiliser is applied, then this can detrimentally affect the growth of the plant. This means that the polarity between fertiliser and plant growth switches from positive to negative. However, both positive and negative polarities cannot be assigned to the same link. It has to be either positive or negative.

The problem of polarity switch generally occurs when there are two causal pathways between a pair of variables. In our example, this would mean there are two casual pathways between fertiliser and plant growth. An example of these causal pathways is shown below.
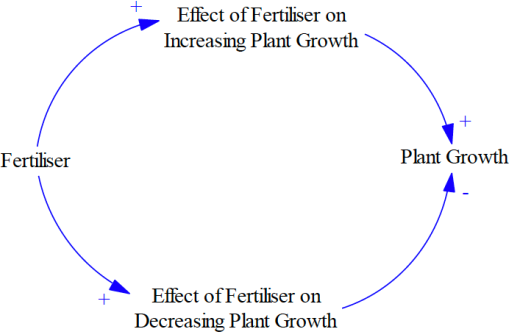
As fertiliser is added, the effect of fertiliser on increasing plant growth goes up, and the effect of fertiliser on decreasing plant growth also goes up. These two effects act to increase, as well as decrease, plant growth. When a small amount of fertiliser is added, the effect of fertiliser on increasing plant growth is dominant. When too much fertiliser is added, the effect of fertiliser on decreasing plant growth becomes dominant. Having these two causal pathways solves the problem because the net effect of add a small amount for fertilise causes plant growth to increase, while the net effect of add a large amount for fertilise causes plant growth the decrease.
Q4: Using a causal loop diagram and a behaviour over time graph, describe the generic structure and behaviour for oscillation. Then, using a causal loop diagram, describe a real world example of oscillation. Include all loop labels and polarities (4 marks)
Note: You must create the CLD and the behaviour over time chart yourself i.e. do not copy from lecture video or other text – you can hand-draw these, photograph them and embed them in your document if you like. You can also use the sketch tools in Word, PPT to create them – they don’t have to be a work of art, they just have to show the key features
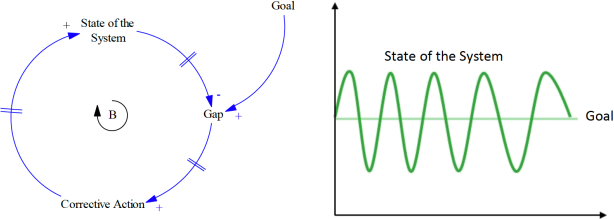
Oscillation is caused by balancing loops containing delays. Below is a CLD and a graph showing the generic structure and behaviour of oscillation. The same balancing loop that creates goal-seeking behaviour is responsible for oscillation, the difference being that there are delays within the loop that cause the state of the system to overshoot and undershoot a goal. There might be a delay between the state of the system changing and detecting a gap between it and the goal. This could occur due to measurement or reporting delays. There might also be a delay between detecting a gap and taking corrective action, due to decision making delays. Finally, there might be a delay between taking corrective action and changing the state of the system, due to action delays.
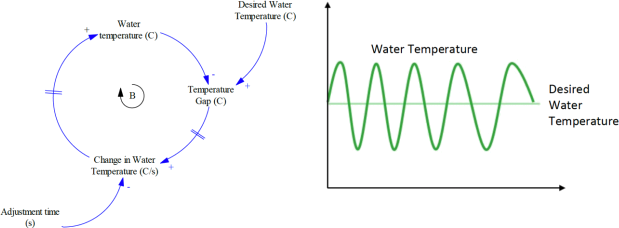
A real world example of oscillation is adjusting the water temperature in the shower. In this case, the water temperature is the state of the system and the goal is the desired water temperature. Usually, when we turn on the tap, the water is too cold, causing a large gap between the water temperature and the desired water temperature. If there is a large gap, the change in water temperature will also be large. This causes an increase in the water temperature, which causes the gap between the current water temperature and the desired water temperature to be reduced. There is a delay between detecting the gap and adjusting the taps. When we adjust the taps, it changes the water temperature, but then there is another delay, that is, the delay between adjusting the taps and changing the actual water temperature. These delays mean that we overshoot and undershoot the desired water temperature a few times before reaching it.
Q5: Describe the situation represented by a Tragedy of the Commons system archetype. Using a causal loop diagram and a graph, describe a real world example of this archetype, the behaviour it produces and the basic management principles for dealing with this archetype. Include all loop labels and polarities (4 marks)
Note: As with Q4, you must re-create the CLD and behaviour over time chart yourself – do not copy and paste from lecture notes or use screen shot
The Tragedy of the Commons archetype represents situations where a common pool resource is overexploited, such as natural resources, people, materials, space, and money. It occurs when individuals attempt to use a common pool resource solely for their own benefit. At first, they gain from the use of the resource, however they experience diminishing returns over time, which causes them to intensify their resource use. Eventually, the resource becomes over exploited, and everyone loses.
Traffic congestion is a real-world example of Tragedy of the Commons. Family A purchase a car to improve their convenience of travel. As their convenience of travel is improved, they are encouraged to purchase more cars for other family members. This creates a reinforcing loop that grows both the number of cars and convenience of travel for family A over time. Soon family A have 2 or 3 cars that they regularly use for travel. Family B do the same, and soon they also have 2 or 3 cars that they regularly use for travel. As each family increases the number and use of cars, the total number of cars in the city increases. After a delay, this leads to traffic congestion because the capacity of the roads is fixed. As traffic congestion increases, this creates balancing loops that reduce the convenience of travel for both family A and B, and everyone loses.
A common response by government to this problem is to simply build more roads and increase the capacity of existing roads by adding more lanes. This removes the road capacity constraint in the short term. However, the reduction in traffic congestion improves the convenience of travel for all road users, which encourages them to use more cars more often. This, after a delay, makes the traffic congestion come back.
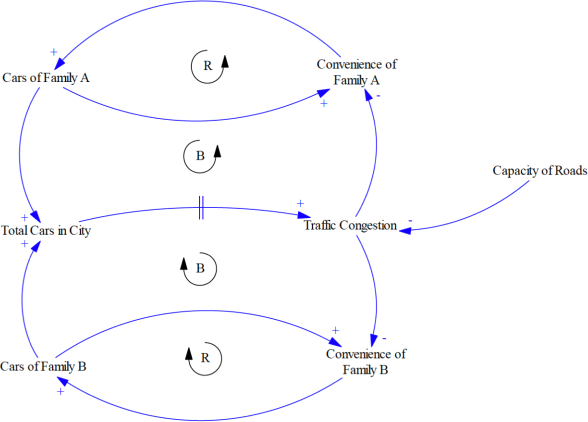
Below is a graph showing the behaviour produced by this example. As family A and B try to maximise their convenience from driving cars, their driving activity increases over time. As the total driving activity in the city increases, traffic congestion increases and both family A and B experience reducing convenience despite their increased driving activity.

The basic management principle for dealing with a Tragedy of the Commons archetype is to manage the common pool resource, either through education and self-regulation, or through official regulation. Quotas or ‘cap and trade’ mechanisms can be used to manage the common pool resource. Taxes can also be used to make the long-term cost of using the common pool resource more present. In the example, this would mean applying a congestion tax to discourage the overuse of private vehicles or by lowering speed limits to make driving less attractive.
2023-08-12