ECMT6006/ECON4949 Mid-Semester Test 2020
Hello, dear friend, you can consult us at any time if you have any questions, add WeChat: daixieit
ECMT6006/ECON4949 Mid-Semester Test
9 April 2020
Note: This is an open-book exam. Please answer all questions. The total mark is 20 and the breakdown is shown in square brackets. The duration of the exam is 1 hour and 10 minutes.
Problem 1. [13 marks] Consider a simple three time period model for returns Rt , t = 1, 2, 3 of an asset. Let R0 = 10%, and the returns in later periods follow an AR(1) process

where ϕ = 0.2 and ε1 ,ε2 ,ε3 are i.i.d. shocks with probability distribution

for t = 1, 2, 3. Let Ft be the information set available at time t. Please answer the following questions.
(i) What is the probability distribution of R1 ? [1]
(ii) What is the probability distribution of R2 ? [1]
(iii) Compute E(R2 ), Var(R2 ), Skew(R2 ) and Kurt(R2 ), the unconditional mean, variance, skewness and kurtosis of R2. [2]
(iv) Explain what mean, variane, skewness and kurtosis tell about the distri- butional properties of a random variable. [2]
(v) Compute the conditional mean E1 (R2 ) := E(R2 |F1 ) and conditional vari- ance Var(R2 |F1 ). [2]
(vi) Verify the law of iterated expectation E(R2 ) = E [E1 (R2 )] using numbers given in this problem. [2]
(vii) Derive the one-period ahead return point forecast R(ˆ)t for t = 1, 2, 3. [1]
(viii) Derive the two standard deviation one-period ahead return interval fore- cast for t = 1, 2, 3. [2]
Problem 2. [7 marks] Figure 1 presents the sample autocorrelation plot for 1-minute returns on IBM and General Electric for the last 10 trading days of 2012.
(i) Please interpret Figure 1. [1]
(ii) Describe how to conduct a robust test jointly for autocorrelation in returns up to lag L using a regression-based approach. Be explicit about the regression model, the null and alternative hypotheses, how to construct the test statistic, and how to make testing decisions. [3]
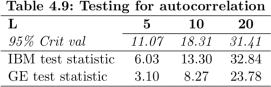
(iii) The table below presents the results from such a test for three choices of L. Interpret these results. [1]
(iv) Figure 2 presents the sample “cross correlation” plot for 1-minute returns
on IBM and General Electric. It shows Corr (Rt(IBM)![]()
from −10 to +10. Interpret this figure [1], and propose a regression-based approach to test jointly for the predictability in IBM returns using (lagged) General Electric returns. [1]
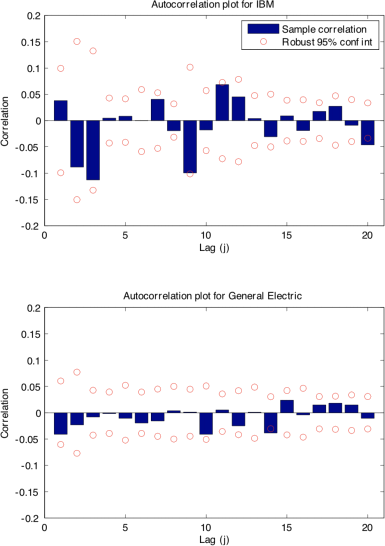
Figure 1: Sample autocorrelation for 1-minute returns on IBM and General Electric.
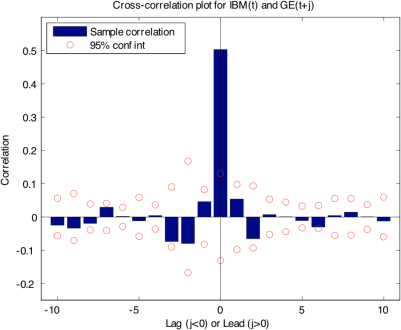
Figure 2: Sample cross-correlation for 1-minute returns on IBM and General Electric.
2023-08-12