BU1007 & Principles of Data Analysis for Business
Hello, dear friend, you can consult us at any time if you have any questions, add WeChat: daixieit
BU1007 & Principles of Data Analysis for Business
1. Introduction
The stock market in the United States has an important influence on the global financial industry. This report analyzes how stock return is influenced by some factors from a dataset of 2000 samples provided by the company. The limitations which may affect the results of the report are the lack of factors, the accuracy of the research method and the time lag of researching. The report starts from the random sampling with 300 samples, provides the description of variables, builds tables for factors, analysis the descriptive statistics and correlation, provides the supported diagrams and makes comparison to related literature.
2. Data summary and descriptive statistics
2.1. Identify the variables’ types and scales of measurement
Data is collected from the original 2000 variables dataset and chooses the random sampling of 300 observations, which concludes Exchange, Stock return, Firm size, Past return, Past trading volume, Industry code and Industry name. Table 1 shows the identify of variables’ type and scale of measurement.
Table 1. Type and scale of variables
|
|
Qualitative or quantitative |
Measurement scale |
|
Exchange (1 for NYSE, 2 for AMEX, 3 for NASDAQ) |
Qualitative |
Nominal |
|
Stock return |
Quantitative |
Interval |
|
Firm size |
Quantitative |
Ratio |
|
Past return |
Quantitative |
Interval |
|
Past trading volume |
Quantitative |
Ratio |
|
Industry code |
Qualitative |
Nominal |
|
Industry name |
Qualitative |
Nominal |
2.2. Descriptive statistics
Table 2 shows the descriptive statistics of 300 companies.
For measures of central location: the mean, median, mode of Stock return is 0.742, 2.524 and NA (Each company has a different Stock return); the mean, median, mode of Firm size is10684, 1040.576 and NA (Each company has a different Firm size).
For measures of variability: the standard deviation, kurtosis and skewness of Stock return is 11.684, 3.736 and - 1.183; the standard deviation, kurtosis and skewness of Firm size is 27576.94, 30.902 and 4.875. The kurtosis greater than 3 means that the distribution is leptokurtic and has more outliers. The skewness less than zero is called negative skew while greater than zero is called positive skew.
For the coefficient of variation (Standard deviation over the mean): Stock return is 15.747 and Firm size is 2.581. The coefficient of variation greater than 1 shows strong variation.
Table 2. Descriptive statistics of 300 Companies
|
300 Companies |
Stock return |
Firm size |
|
Mean |
0.742 |
10684 |
|
Standard error |
0.675 |
1592.156 |
|
Median |
2.524 |
1040.576 |
|
Mode |
NA |
NA |
|
Standard deviation |
11.684 |
27576.94 |
|
Sample variation |
136.520 |
760487779.132 |
|
kurtosis |
3.736 |
30.902 |
|
Skewness |
- 1.183 |
4.875 |
|
Range |
94.389 |
263369.042 |
|
Minimum |
-61.337 |
9.301 |
|
Maximum |
33.052 |
263378.343 |
|
Sum |
222.709 |
3205198.719 |
|
Count |
300 |
300 |
3. Frequency distribution
Figure 1 shows the bar chart of frequency distribution of Stock exchanges. NYSE 45.33%, AMEX 6.33% and NASDAQ 48.33%.
Figure 2 shows the bar chart of frequency distribution of Industries. Agriculture, Forestry and Fishing 1.67%, Mining 4.33%, Construction 1%, Manufacturing 33.67%, Transportation, Communications, Electric, Gas and Sanitary service 7.33%, Wholesale 4%, Retail Trade 5.67%, Finance, Insurance and Real Estate 24.67% and Services 17.67%.
Figure 1. Frequency distribution of Stock Exchanges
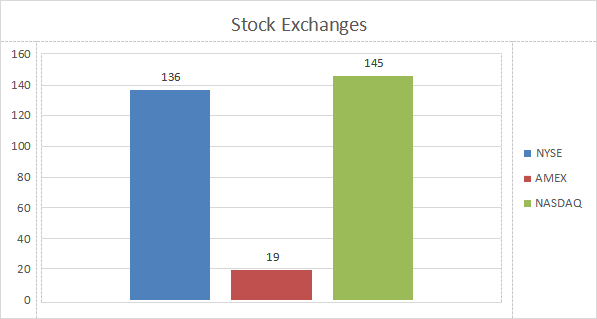
Figure 2. Frequency distribution of Industries

4. Average stock return in different sample space
Table 3 and Figure 3 provide joint information on Stock Exchanges and Average stock return. The result is 2.989 for NYSE, -8.252 for AMEX and -0.182 for NASDAQ.
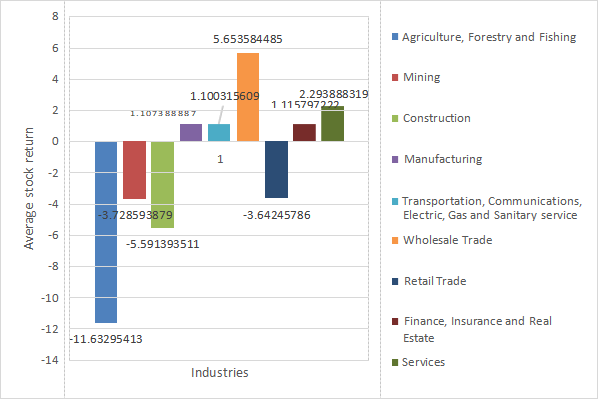
Table 4 and Figure 4 provide joint information on Industries and Average stock return. The result is - 11.633 for Agriculture, Forestry and Fishing, -3.729 for Mining, -5.591 for Construction, 1.107 for Manufacturing, 1.100 for Transportation, Communications, Electric, Gas and Sanitary service, 5.654 for Wholesale, -3.642 for Retail Trade, 1.116 for Finance, Insurance and Real Estate and 2.294 for Services.
Table 3. Stock Exchanges and Average stock return
|
Stock Exchanges |
Average stock return |
|
NYSE |
2.989 |
|
AMEX |
-8.252 |
|
NASDAQ |
-0.182 |
Figure 3. Stock Exchanges and Average stock return
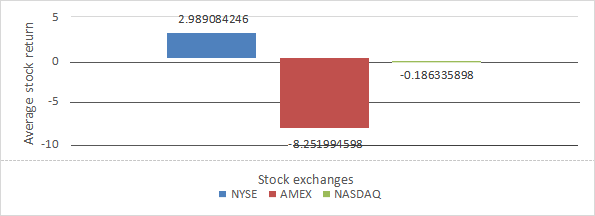
Table 4. Industries and Average stock return
|
Industries |
Average stock return |
|
Agriculture, Forestry and Fishing |
- 11.633 |
|
Mining |
-3.729 |
|
Construction |
-5.591 |
|
Manufacturing |
1.107 |
|
Transportation, Communications, Electric, Gas and Sanitary service |
1.100 |
|
Wholesale |
5.654 |
|
Retail Trade |
-3.642 |
|
Finance, Insurance and Real Estate |
1.116 |
|
Services |
2.294 |
Figure 4. Industries and Average stock return
5. Correlation analysis on stock return with factors
Table 5 shows the correlation analysis for Stock return and Firm size, Past return, Past trading volume. The result is 0.159, 0.106 and 0.078 which show weak correlation.
Figure 5, 6 and 7 shows the scatter plot of the Stock return and Firm size, Past return, Past trading volume.
Table 5. Correlation analysis for Stock return and Firm size,
Past return, Past trading volume
|
|
Stock return |
Firm size |
Past return |
Past trading volume |
|
Stock return |
1 |
|
|
|
|
Firm size |
0.159449791 |
1 |
|
|
|
Past return |
0.105733554 |
|
1 |
|
|
Past trading volume |
0.078125405 |
|
|
1 |
Figure 5. Correlation analysis for Stock return and Firm size
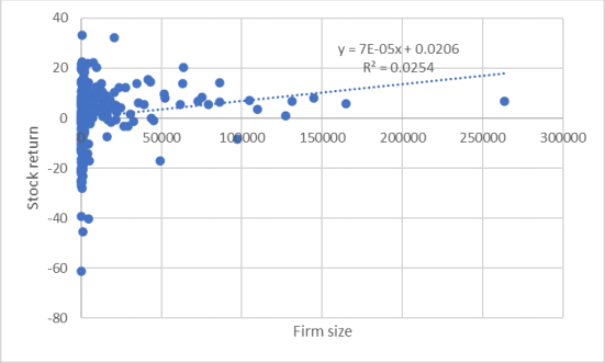
Figure 6. Correlation analysis for Stock return and Past return
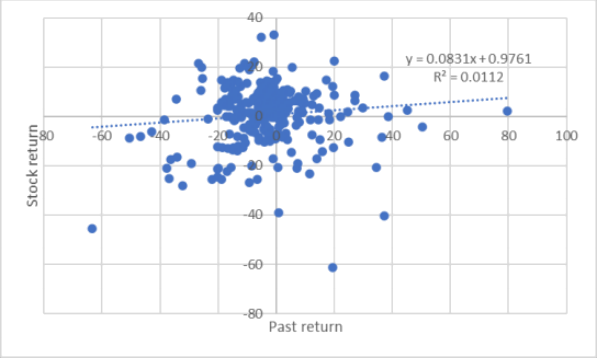
Figure 7. Correlation analysis for Stock return and Past trading volume

6. Conclusions and Recommendations
After summarizing the above data, the report provides some conclusions.
a) The descriptive statistic on the 300 companies shows a large measure of dispersion.
b) Most of companies choose NYSE and NASDAQ stock exchange and a few choose AMEX.
c) The most popular industry is Manufacturing and the least is Construction.
d) NYSE has a positive average stock return while AMEX and NASDAQ have a negative average stock return.
e) The average stock return of industry shows disordered. The Transportation, Communications, Electric, Gas and Sanitary service industry has a lowest average stock return as - 11.633. Meanwhile, Wholesale has the highest as average stock return 5.654.
f) The correlation analysis on Stock return with Firm size, Past return and Past trading volume shows positive yet insignificant relation.
In conclusion, the market of the stock exchanges shows negative performance and unpredictability. Therefore, it is better for investors in the stock market to focus on the financial news, global economic trend and long-term plan.
7. Comparison with related literature
The related literature introduces the difference among NYSE, AMEX and NASDAQ. The NYSE is the largest American stock exchange by volume and the NASDAQ attract investors from worldwide through online trades, while the AMEX is popular in small companies which have no ability meet NYSE (David Ingram. N.d.). Basically, comparing to the literature, this report figures out an accurate frequency distribution on three exchanges.
There are some reports research the relationship on factors effecting stock return. In conclusion, the relation between stock return and Firm size (Mazviona & Batsirai Winmore & Davis Nyangara, 2014), Past return and Past trading volume (Vikash Ramiah & Ka Yeung Cheng & Julien Orriols & Tony Naughton & Terrence Hallahan, 2011) shows indistinctive relationship. It is similar to this report’s correlation analysis conclusion.
(Body 825 words)
References
David Ingram. (n.d.). The Difference Between AMEX, NYSE & NASDAQ.
https://www.sapling.com/8007619/difference-between-amex-nyse-nasdaq
Mazviona & Batsirai Winmore & Davis Nyangara. (2014.). Does firm size affect stock
returns? Evidence from the Zimbabwe Stock Exchange. JCU online library.
https://jcu.primo.exlibrisgroup.com/discovery/fulldisplay?docid=cdi_doaj_primary_oai_ doaj_org_article_549cc03596594b9ca71e007a4d5cd887&context=PC&vid=61ARL_JC U:JCU&lang=en&search_scope=MyInst_and_CI&adaptor=Primo%20Central&tab=Ever
ything&query=any,contains,Stock%20return%20and%20firm%20size&offset=20
Vikash Ramiah & Ka Yeung Cheng & Julien Orriols & Tony Naughton & Terrence
Hallahan. (2011.). Contrarian investment strategies work better for dually-traded stocks:
Evidence from HongKong. p154- 155.
https://jcu.primo.exlibrisgroup.com/discovery/fulldisplay?docid=cdi_crossref_primary_ 1 0_ 1016 j pacfin_2010_09_005&context=PC&vid=61ARL_JCU:JCU&lang=en&search _scope=MyInst_and_CI&adaptor=Primo%20Central&tab=Everything&query=any,conta
ins,stock%20return%20and%20past%20trading%20volume&mode=basic
2023-08-07