ECS607U DATA MINING Winter Examination Period 2023
Hello, dear friend, you can consult us at any time if you have any questions, add WeChat: daixieit
Winter Examination Period 2023 — January — Semester A
ECS607U DATA MINING
Duration: 2 hours
Question 1
(a) A group of 12 sales price records are as follows:
5, 215, 72, 13, 11, 204, 92, 55, 50, 10, 35, 15
(i) Partition them into three bins by equal-frequency binning and then use smoothing by bin boundaries to smooth them.
(ii) Partition them into three bins by equal-width binning and then use smoothing by bin mean to smooth them. [13 marks]
(b) Some scientists want to know if education level (attribute A or in other words feature A) and marital status (attribute B or in other words feature B) are related for all people in some country. Therefore they collect data on a simple random sample of n = 1000 people. The marital status of these people is either married, or not- married, or widowed. The education level of these people is either attended-school or attended-university. From these 1000 people: i) 200 had attended-school and were married; ii) 100 had attended-school and were not-married; iii) 100 had attended- school and were widowed; iv) 300 had attended-university and were married; v) 200 had attended-university and were not-married; vi) 100 had attended-university and were widowed.
(i) Create the contingency table e (i.e. observed frequencies) of education level versus marital status. Indicate also the expected frequencies and show their derivation.
(ii) Calculate the degrees of freedom for the above contingency table.
(iii) The hypothesis that the scientists want to check is whether the education level and marital status are independent. Assume that the scientists set the significance level α to 0.0001. Assume also that the value needed to reject this hypothesis at this α significance level is 18.5. Provide an answer and a justification (by showing all derivation steps) whether the hypothesis is rejected or not. [12 marks]
Question 2
(a) Suppose that a data warehouse for University consists of the following four dimensions: student, course, semester, and instructor, and two measures count and avg grade. When at the lowest conceptual level (e.g., for a given student, course, semester, and instructor combination), the avg grade measure stores the actual course grade of the student. At higher conceptual levels, avg grade stores the average grade for the given combination.
(i) Draw a snowflake schema diagram for the data warehouse.
(ii) Starting with the base cuboid [student, course, semester, instructor],what specific OLAP operations (e.g., roll-up from semester to year) should one perform in order to list the average grade of CS courses for each University student.
(iii) If each dimension has five levels (including all),such as
”student < major < status < university < all”, how many cuboids will this cube contain (including the base and apex cuboids)? [14 marks]
(b) Suppose that a data warehouse consists of the four dimensions: date, spectator, location, and game, and two measures count and charge, where charge is the fare that a spectator pays when watching a game on a given date. Spectators may be students, adults, or seniors, with each category having its own charge rate.
(i) Draw a star schema diagram for the data warehouse.
(ii) Starting with the base cuboid [date, spectator, location, game], what specific OLAP operations should one perform in order to list the total charge paid by student spectators at PH Place in 2015? [11 marks]
Question 3
Suppose you have a list of points, i.e., 2D coordinates, shown in the Table below. Your goal is to cluster these points into three distinct clusters using the K-means algorithm. Suppose initially we assign A, C, and G as the centers of each cluster, respectively. Use the Euclidean distance as the distance measure.

(a) Show the 3 clusters, along with their new centers at the first round of iteration of the K-means algorithm. In other words, determine which points will be assigned to each cluster at the first round of iteration; after that, compute the new centroids (i.e., centers of each cluster). [7 marks]
(b) Run the K-means algorithm until convergence. At each iteration of the algorithm, show only the 3 clusters. For this question, you do not need to show derivation steps and the calculations with the Euclidean distance, just report which points belong to each cluster at each iteration. [10 marks]
(c) Assume that each point of the above Table further contains a class label. Points A, B and C belong to class 0; points D and E belong to class 1; point E belongs to class 2; point F belongs to class 3; points G and H belong to class 4. Assign classes to the clusters that you found on question (b), based on the majority value of the class attribute within each cluster. Discuss a problem which you observe. What would be the difference if you run K-means with 7 clusters (K=7)? You do not need to run the algorithm in this case. [8 marks]
Question 4
(a) Indicate whether the below statements are True (T) or False (F). No justification of the answer is needed.
(i) Our use of association analysis will yield the same frequent itemsets and strong as- sociation rules whether a specific item occurs once or three times in an individual transaction.
(ii) In association rule mining the generation of the frequent itermsets is a computa- tionally intensive step.
(iii) Suppose ABC is a frequent itemset and BCDE is NOT a frequent itemset. Given this information, we can be sure that BC is certainly frequent.
(iv) Suppose ABC is a frequent itemset and BCDE is NOT a frequent itemset. Given this information, we can be sure that BCE is certainly not frequent.
(v) The k-means clustering algorithm will automatically find the best value of k as part of its normal operation. [5 marks]
(b) A database has 4 transactions, shown below:
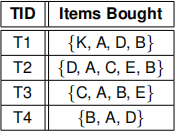
Assuming a minimum level of support min sup = 60% and a minimum level of confi - dencemin
 ![]() conf = 80% :
conf = 80% :
(i) Use the Apriori algorithm to find the frequent itemset(s). Then list all frequent itemsets that can be derived from the frequent itemset(s) of the algorithm (not just the ones with the maximum width/length). Just showing the final answer is not acceptable; show all steps of the algorithm by appropriate justification. For each iteration (k) show the candidate (Ck ) and acceptable frequent itemsets (Lk ).
(ii) List all of the association rules that: i) can be derived based on the frequent itemset(s) of the previous question and ii) are in the form {X, Y} ⇒ Z (where X, Y, Z are items). This means that you do not have to list and worry about rules of the form X ⇒ Z (where X, Z are items). While showing the association rules, show also their support and confidence values. Finally, mention and explain which of these association rules are strong. [12 marks]
(c) Suppose we have 7 items numbered as 1,2,...,7. Which of the following two association rules has a confidence that is certain to beat least as great as the confidence of
{1, 2} ⇒ {3, 4, 5, 6, 7} and no greater than the confidence of {1, 2, 3, 4} ⇒ 5?
1. {1, 2, 4} ⇒ {3, 5, 6}
2. {1, 2, 4} ⇒ {3, 6, 7}
Show the derivation steps to justify your answer.
Hint: Think which is the formula for computing the confidence of an association rule and then what stands for the support of subsets of itemsets (i.e., if A, B are itemsets and A 己 B, then what do you know for SA and SB ). [4 marks]
(d) In general, we would be more interested in association rules with high confidence. However, often we would not be interested in association rules that have a confidence of 100%. Why? Then specifically explain why association rules with 99% confidence may be interesting (i.e., what might they indicate)? [4 marks]
2023-08-04